Most retirement plan sponsors and fiduciaries design well-thought-out, diversified portfolios for retirement plan participants. However, in comparing U.S. defined benefit (DB) and defined contribution (DC) plans such as 401k, 403b, and 457 retirement plans, we notice differences in private asset allocations, in particular, to private real estate, despite both plan types seeking to solve for the same goal: income replacement in retirement. As a percentage of assets under management (AUM) amongst private real estate investment managers, DB and DC plans accounted for a respective 42.8% and 4.7% in 2023.1
Why the difference? And why don’t DC plans offer equivalent private asset exposure? Data suggests that DC plans utilize publicly listed real estate investment trust (REIT) securities rather than private real estate to meet their real estate allocation requirements. Is the lack of exposure to private real estate detracting from participant outcomes and a better portfolio mix?
In this paper, we will show that there is compelling data for DC plan sponsors to consider including private real estate as an investment option in a multi-asset retirement plan.
LISTED REITS VS. PRIVATE REAL ESTATE: REAL ESTATE IN DIFFERENT OWNERSHIP STRUCTURES
Real estate is the third-largest asset class in the U.S. with over $12 Trillion in total assets.2 Currently, U.S. commercial real estate is 89% privately held and 11% owned by listed REITs (Figure 1).3 Within real estate, institutional investors now allocate 10.8% on average to private real estate − 94% to private real estate equity and only 4% to listed REITs (and 2% to private and public real estate debt).4 On the other hand, within DC plans, most sponsors allocate overwhelmingly to listed REITs.
FIGURE 1: REAL ESTATE AS AN ASSET CLASS
Source: Securities Industry and Financial Markets Association, Urban Land Institute, U.S. Bureau of Economic Analysis (BEA), NAREIT, NCREIF, Moody’s Analytics, Clarion Partners Investment Research, Q4 2023. Note: Annual data and estimates as of Q4 2023. U.S. debt includes corporate securities, ABS, treasury debt, Federal agency debt including MBS, money market funds, and muni bonds. U.S. real estate includes private and public equity investment.
Defined contribution investors typically access listed REITs via REIT index funds, actively traded mutual funds, or collective investment trusts (CITs). Undoubtedly, listed REITs offer a liquid option to access commercial real estate, which is perhaps the driving factor accounting for their outsized allocation in DC plans.
Private, or “direct” real estate is ownership of physical property, typically professionally managed by an institutional investor. Private real estate is most often accessed through open or closed-end funds (typically limited partnerships) or through separate accounts.
While both public and private forms of ownership aim to generate cash flow and appreciation from the underlying real estate, the varying structures have important bearings on overall portfolio construction and outcomes. Key differences are their relative liquidity and valuation processes.
BENEFITS OF PRIVATE REAL ESTATE
The higher allocation within U.S. DB plans towards private real estate are likely driven by: 1) diversification, 2) generally stable, income-based returns, and 3) some inflation-hedging properties.
- Low Correlation with Traditional Asset Classes. Core private real estate’s low correlation with traditional asset classes has delivered downside protection and preserved value within participant retirement portfolios during periods of broader market drawdowns (Figure 2).
- Listed REITs Have Higher Volatility. In contrast, listed REITs have a 68% correlation to equities, as they are traded on public exchanges like the NYSE, and general market sentiment has a large effect on value. As a result, REITs that are publicly traded tend to have higher volatility relative to private real estate, where valuations are not subject to stock market movements. As such, private real estate has a relatively high return per unit of risk − measured by the Sharpe Ratio (Figure 2).
- Less Volatile Return History. Over the past 25 years, publicly listed REITs, measured by the NAREIT All Equity REITs Index, reported 29 negative quarters (29% of the time), while private real estate as measured by the NFI-ODCE Index was negative 13 quarters / 13% of the time, demonstrating that private real estate has been much less volatile than publicly listed REITs (Figure 2).
Thus, the addition of private real estate, which has beneficial risk-return characteristics, is generally additive to portfolio construction and outcomes.
FIGURE 2: PRIVATE VS. PUBLIC REAL ESTATE TOTAL RETURNS, CORRELATIONS & VOLATILITY (1998-2024)
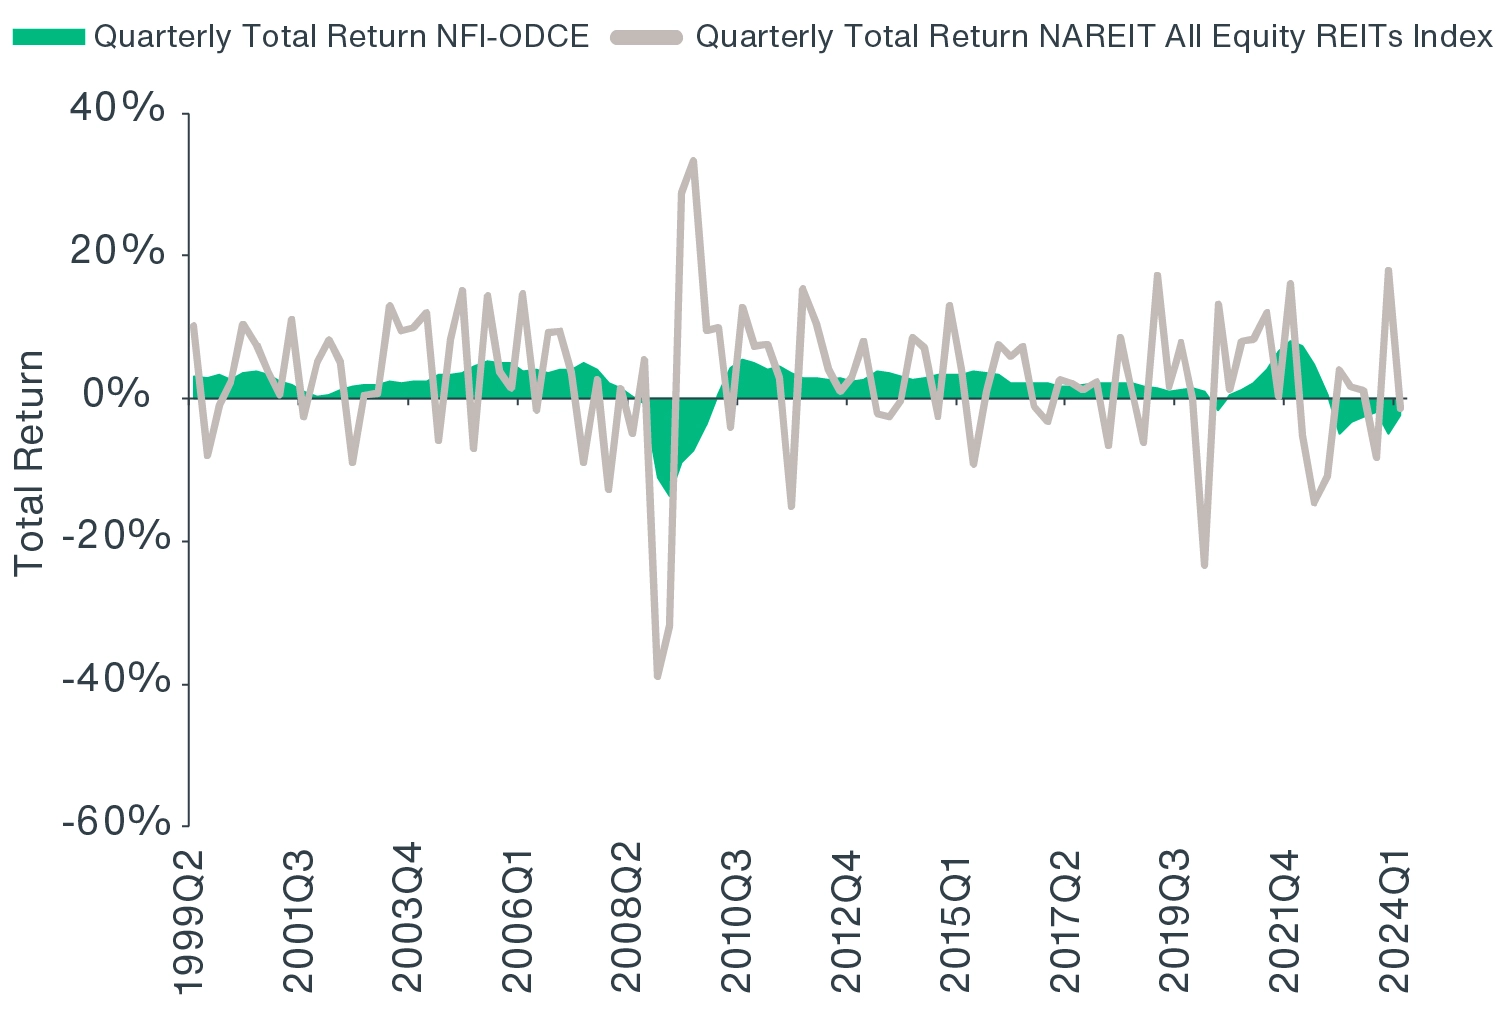
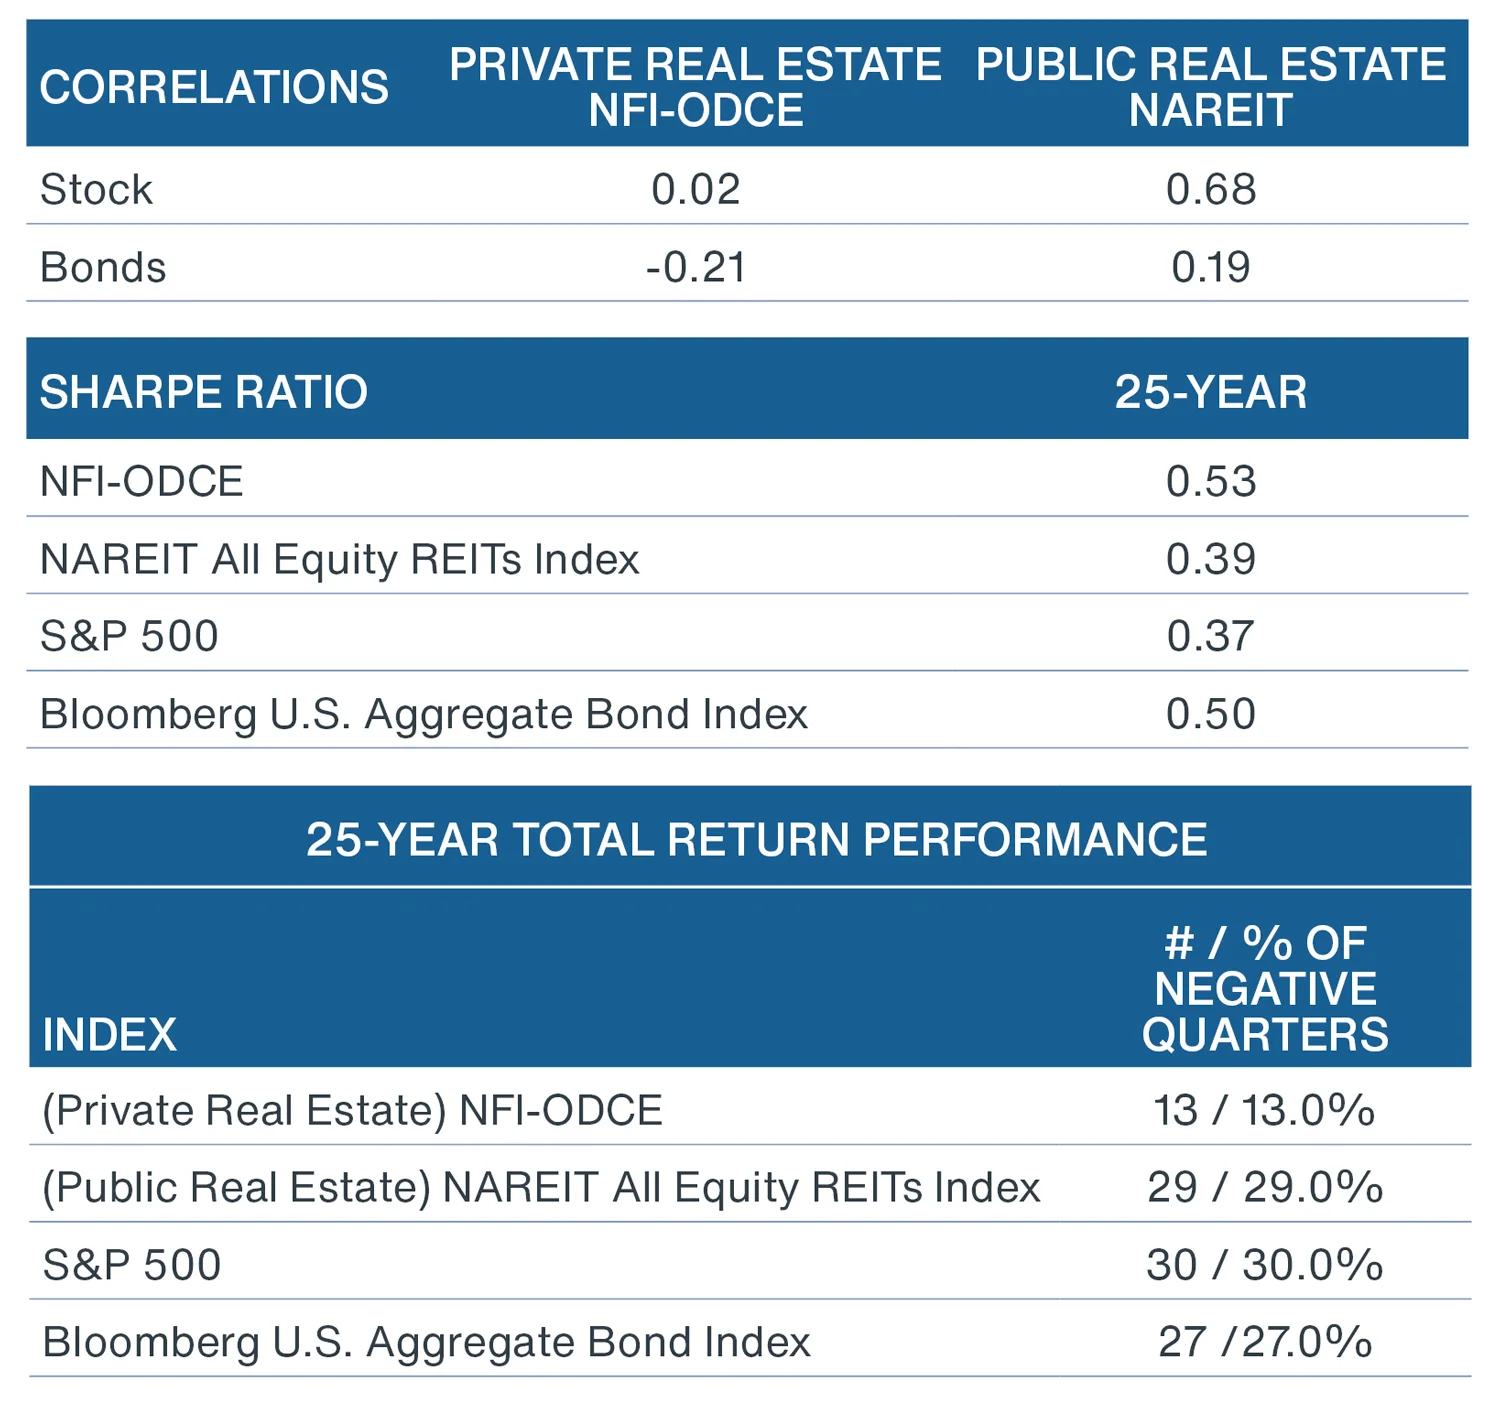
Source: Clarion Partners Investment Research, NCREIF, Bloomberg, Q1 2024. Note: Private Real Estate = NFI-ODCE. Sharpe ratio is calculated by the mean of excess performance of fund return to risk-free-rate, divided by the standard deviation of the performance in excess of the risk-free rate. Risk-free-rate is 90 days T-bills as of 3/28/2024. The methodology is consistent with NCREIF Analytics Tool.
To demonstrate the advantages of private real estate, we created a hypothetical portfolio comprising a 60/40 stock/bond allocation and compared its absolute and risk-adjusted performance to a similar portfolio with a 10% allocation to private real estate. As Figure 3 shows, the addition of 10% in private real estate to a 60/40 stock/bond portfolio increased the return per unit risk, resulting in 12% better risk adjusted returns.
FIGURE 3: HYPOTHETICAL 10-YEAR PORTFOLIO WITH AND WITHOUT
PRIVATE EQUITY REAL ESTATE
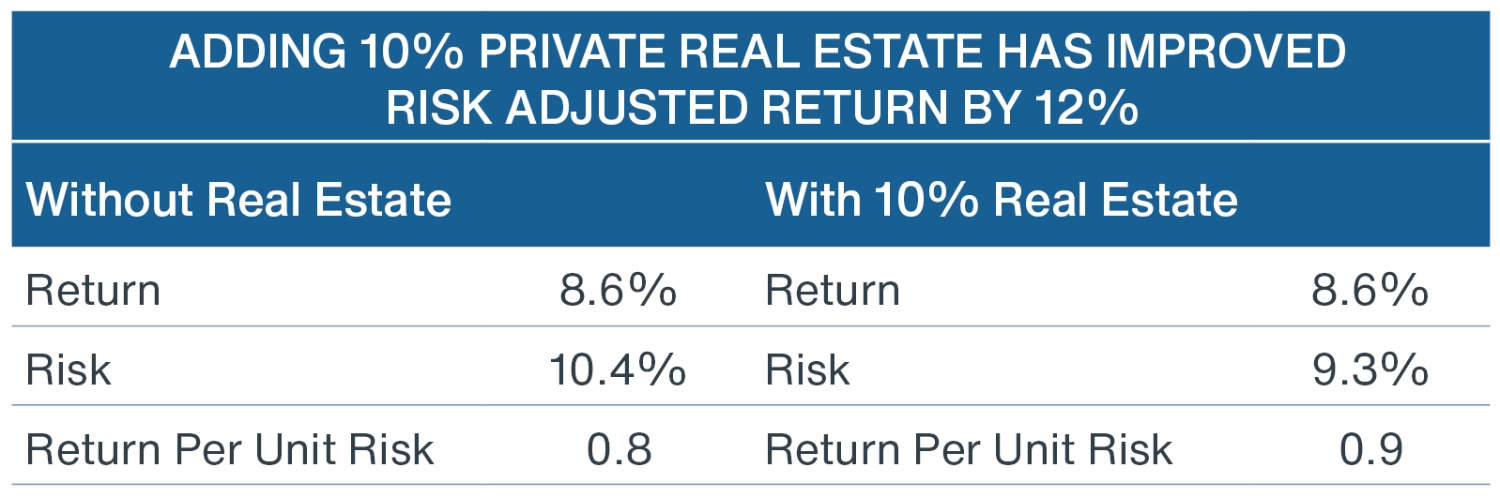

Source: Clarion Partners Investment Research, NCREIF, Bloomberg, NAREIT, Q1 2024. Note: Real Estate = NFI-ODCE. The 10-year period is a quarterly return from Q2 2014 to Q1 2024.
A recent study from the Georgetown Center for Retirement Research and CEM Benchmarking also showed the benefit of including private real estate in target date funds (TDFs). It concluded that adding 10% private real estate to a typical TDF both enhanced returns (annual retirement income) for 401k investors and reduced volatility in 100% of the simulations.5
Another way to illustrate the benefits of adding private real estate to a portfolio is to plot the efficient frontier, which shows the optimal combinations of asset classes that maximize return for a given level of risk. Figure 4 below shows the 25-year efficient frontier for a hypothetical portfolio comprising stocks, bonds, and private real estate.
Figure 4 shows that adding private real estate to a stock-bond portfolio historically shifted the frontier upward and to the left, indicating higher returns and lower volatility. The data would suggest that private real estate can be a powerful addition to a balanced portfolio and therefore merits inclusion in DC plans.
FIGURE 4: 25-YEAR EFFICIENT FRONTIER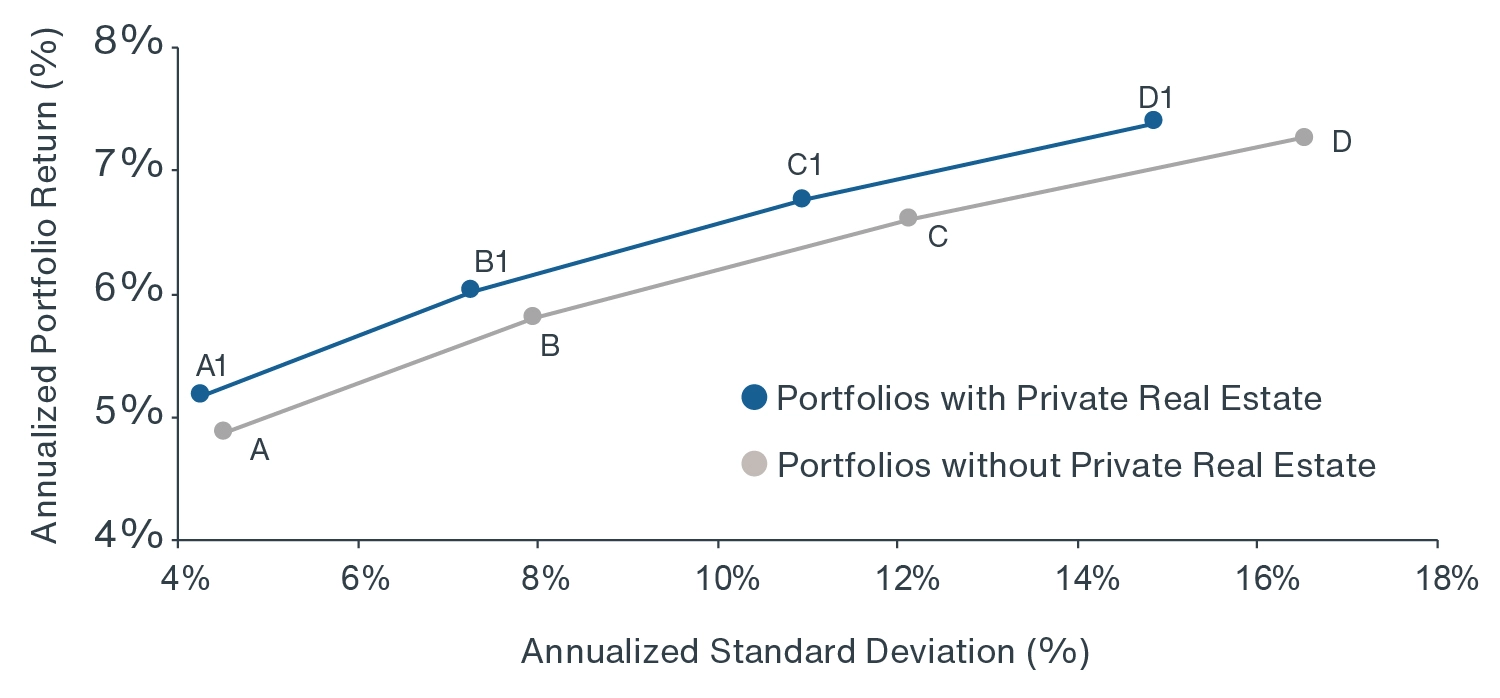
Source: Clarion Partners Investment Research, NCREIF, NAREIT, S&P, Bloomberg, Q1 2024. Note: Private Real Estate = NFI-ODCE; Stock = S&P 500; Bond = Bloomberg U.S. Aggregate Bond Index; 25-Year analysis is based on quarterly total return from Q2 1999-Q1 2024. Blended portfolio return is a weighted average of quarterly total returns. Portfolios without Private Real Estate: A: 20% stocks, 80% bonds; B: 40% stocks, 60% bonds; C: 60% stocks, 40% bonds; D: 80% stocks, 20% bonds. Portfolios with Private Real Estate: A1: 18% stocks, 72% bonds, 10% real estate; B1:
36% stocks, 54% bonds, 10% real estate; C1: 54% stocks, 36% bonds, 10% real estate; D1: 72% stocks, 18% bonds, 10% real estate.
WHY ARE DEFINED CONTRIBUTION PLANS USING PRIVATE REAL ESTATE LESS IN PORTFOLIOS?
Since both forms of ownership offer investors access to high–quality commercial real estate and given the benefits outlined above, why have more DC plans not utilized private real estate? Perhaps plan sponsors and fiduciaries are simply prioritizing perceived ease of implementation over participant benefits given the broad availability and liquidity of publicly listed REIT mutual and CITs.
Below, we identify possible retirement plan sponsor concerns that may be impacting a greater allocation to private real estate and solutions to solve them:
- I don’t want high-risk
private equity in my plan. Private real estate is much different from private equity (PE) strategies that may come to mind when thinking
about private assets. PE strategies buy and manage private companies and are considered higher risk than
public equity. PE funds are generally illiquid, closed-end, and require a 7- to 10-year investment. Private core real
estate funds take direct ownership of institutional quality, income producing commercial properties (industrial,
retail, multifamily, and office) in an open-end fund format, offering periodic liquidity to institutional investors.
Modern private real estate funds now offer greater liquidity.
- Private assets won’t work
in my DC plan. Participants in the 401k ecosystem (custodians, recordkeepers, managed account providers, glide path managers,
consultants, and asset managers) have all worked through the operational issues that previously hampered the
adoption of private real estate in DC plans. Today, private real estate strategies are typically delivered in CITs that
offer daily valuation and daily tradability via recordkeeping and clearing systems.
- I don’t want my participants to
give up liquidity. Modern private real estate strategies designed for DC plans typically offer daily liquidity to accommodate for
participant contributions, exchanges, and re-balancing. Liquidity is achieved by blending private real estate,
typically (70-85% of the fund), with a highly liquid passive listed REIT strategy (typically 15-30% of the fund).
Most private real estate allocations are included in professionally managed portfolios, such as custom target
date funds, custom white label real assets funds or custom managed accounts. These structures allow a
professional fiduciary to oversee rebalancing and plan level liquidity needs.
- Private fund fees are too high. Most core private real estate strategies charge a reasonable asset management fee with no performance fees,
comparable with traditional long-only equity and fixed income managers.5
- I don’t want to be first. There is no doubt that the U.S. DC industry is risk averse. Decisionmakers, from plan sponsors to consultants,
often seek to avoid any option that might be perceived as too risky. As we outlined in our recent blog post, the first
reaction for many DC decisionmakers is “That sounds risky, I’ll wait until others have blazed that trail. We don’t want
to be first.” Today, there are over a dozen daily valued, daily tradable, daily liquid private real estate products in the
market. DC plans hold over $59 billion in private real estate strategies.6
Furthermore, several of the largest target date fund managers see the benefits of private real estate. Household
names like Fidelity Investments, Prudential Global Investment Management, JP Morgan Asset Management,
TIAA/Nuveen, Callan Glidepath Funds, and MissionSquare Investments have all added private real estate
exposure to their off-the-shelf TDFs for the diversification, income, inflation protection, and volatility dampening
benefits discussed earlier.
A POSSIBLE SOLUTION: BLEND PRIVATE & PUBLIC REAL ESTATE TO DELIVER HOLISTIC PORTFOLIO OUTCOMES
We recognize that implementing a larger allocation to private real estate may require greater awareness of product viability and relative performance, especially given the ease of implementation that listed REITs offer.
A possible solution for plan sponsors is to create a blended strategy that includes public and private real estate. A mixed portfolio would offer participants access to institutional quality real estate and greater liquidity − a key component for inclusion in DC plans, as well as operational and investment benefits.
As seen in Figure 5, combining 85% private real estate with 15% listed REITs reduces volatility over the past 1-,3- 5- and 10-year periods versus using private real estate alone, further enhancing participant outcomes. A combination of private and public real estate could be a solution that DC plans can explore as a means to moving towards the goal of incorporating more private real estate into retirement plans.
We believe that adding private real estate to participant directed DC plans such as 401k, 401b, and 457 retirement plans not only increases risk-adjusted returns for professionally managed multi-asset portfolios (such as target date, target risk and managed accounts), but also results in a better in-plan participant experience and higher income replacement ratios.
FIGURE 5: VOLATILITY OF PRIVATE REAL ESTATE, REITS, AND A BLENDED PORTFOLIO
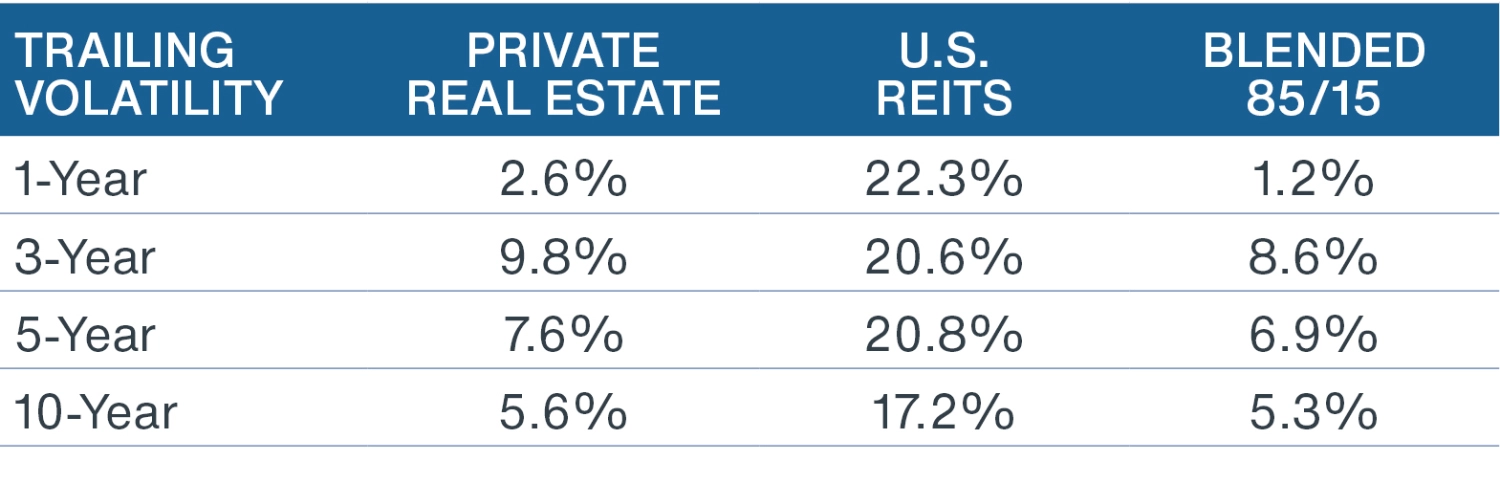
Source: NCREIF, Bloomberg, NAREIT, Clarion Partners Investment Research, Q1 2024. Note: Private Real Estate = NFI-ODCE.
CONCLUSION
U.S. DC plans now hold over $10 Trillion in retirement funds, a sizable share of the $39 Trillion in U.S. retirement AUM. Furthermore, DC plans now eclipse private sector DB plans in AUM, which continues to rise rapidly.7 Over the next decade, we expect commercial real estate to grow meaningfully as a share of overall DC capital commitments. However, listed REIT mutual funds and CITs will not be the only way to get real estate exposure. Clarion Partners believes that DC plan sponsors and consultants should use the same tools that DB plans have used for years. Thus, we recommend using modern private and blended real estate solutions to complement and enhance real estate outcomes. |
|