PORTFOLIO ALLOCATIONS RISE SIGNIFICANTLY AMIDST ONGOING OUTPERFORMANCE
Investor interest in U.S. industrial real estate has reached a record high amidst historically strong property-level fundamentals. The sector has continued to be the best-performing property type tracked by the private real estate return benchmark over the past two decades (Figure 1). Although industrial property values have been impacted by the interest-rate driven correction that began in 2H 2022, as have all property types, Clarion Partners is optimistic that values will stabilize in the year ahead as debt rates improve.
FIGURE 1: NPI VS. INDUSTRIAL TOTAL RETURN HISTORY
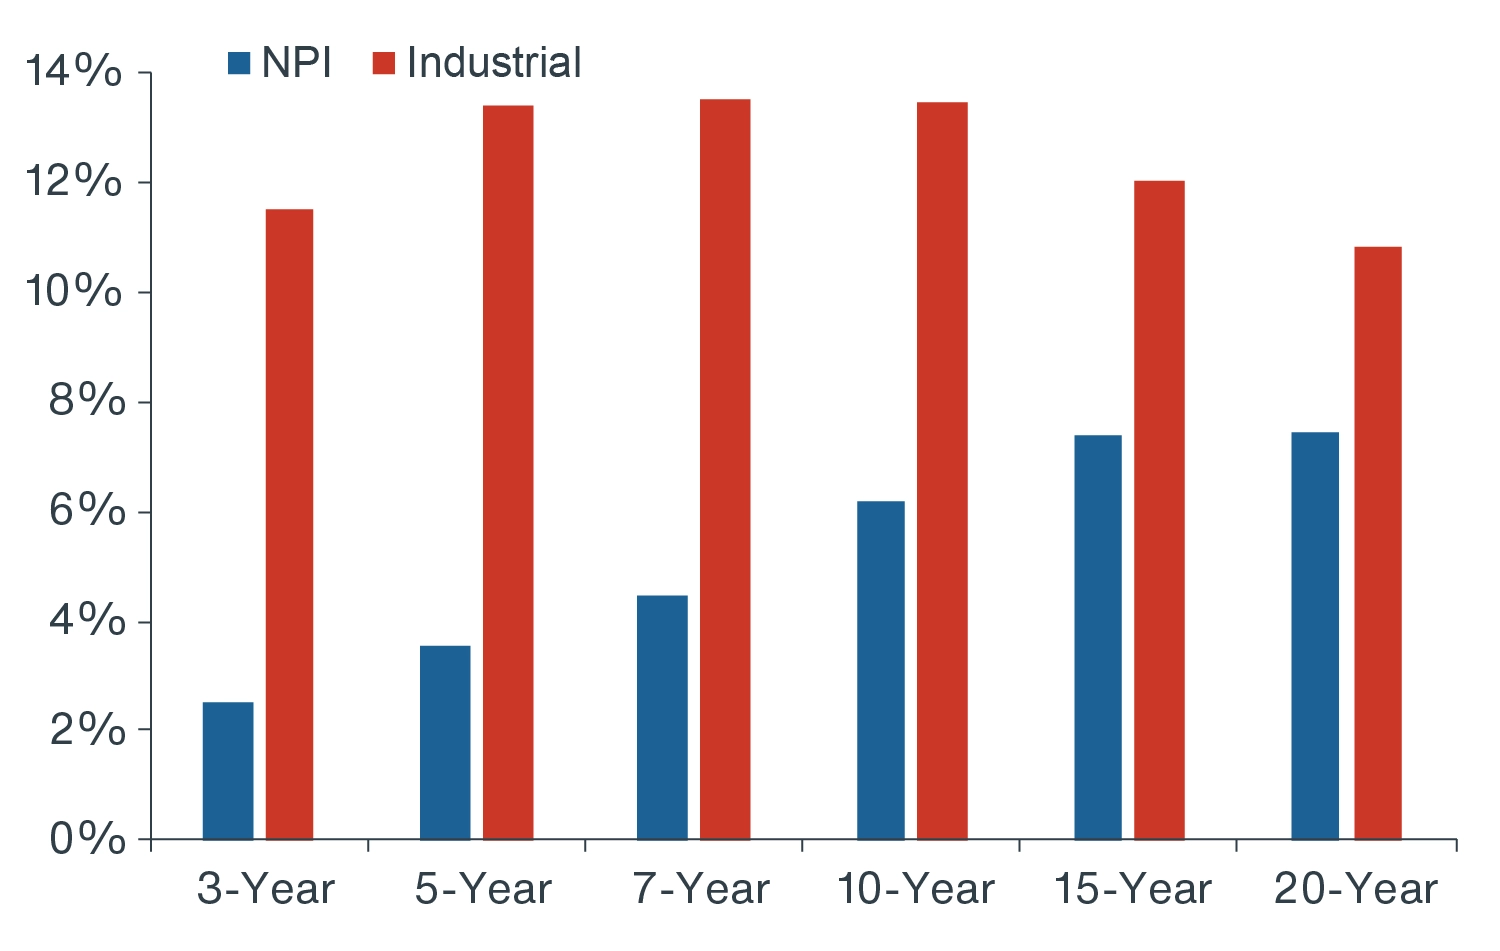
Source: NCREIF, Clarion Partners Investment Research, Q2 2024.1 Note: Based on the Expanded NPI.
Strong performance has attracted significant capital flows, and institutional investor allocations have reached a record high, rising from 14% in 2017 to 35% in 2023 (Figure 2). Clarion Partners believes industrial property will remain a compelling long-term investment opportunity due to a robust set of demand drivers.
FIGURE 2: NPI SECTOR ALLOCATION IN RECENT HISTORY
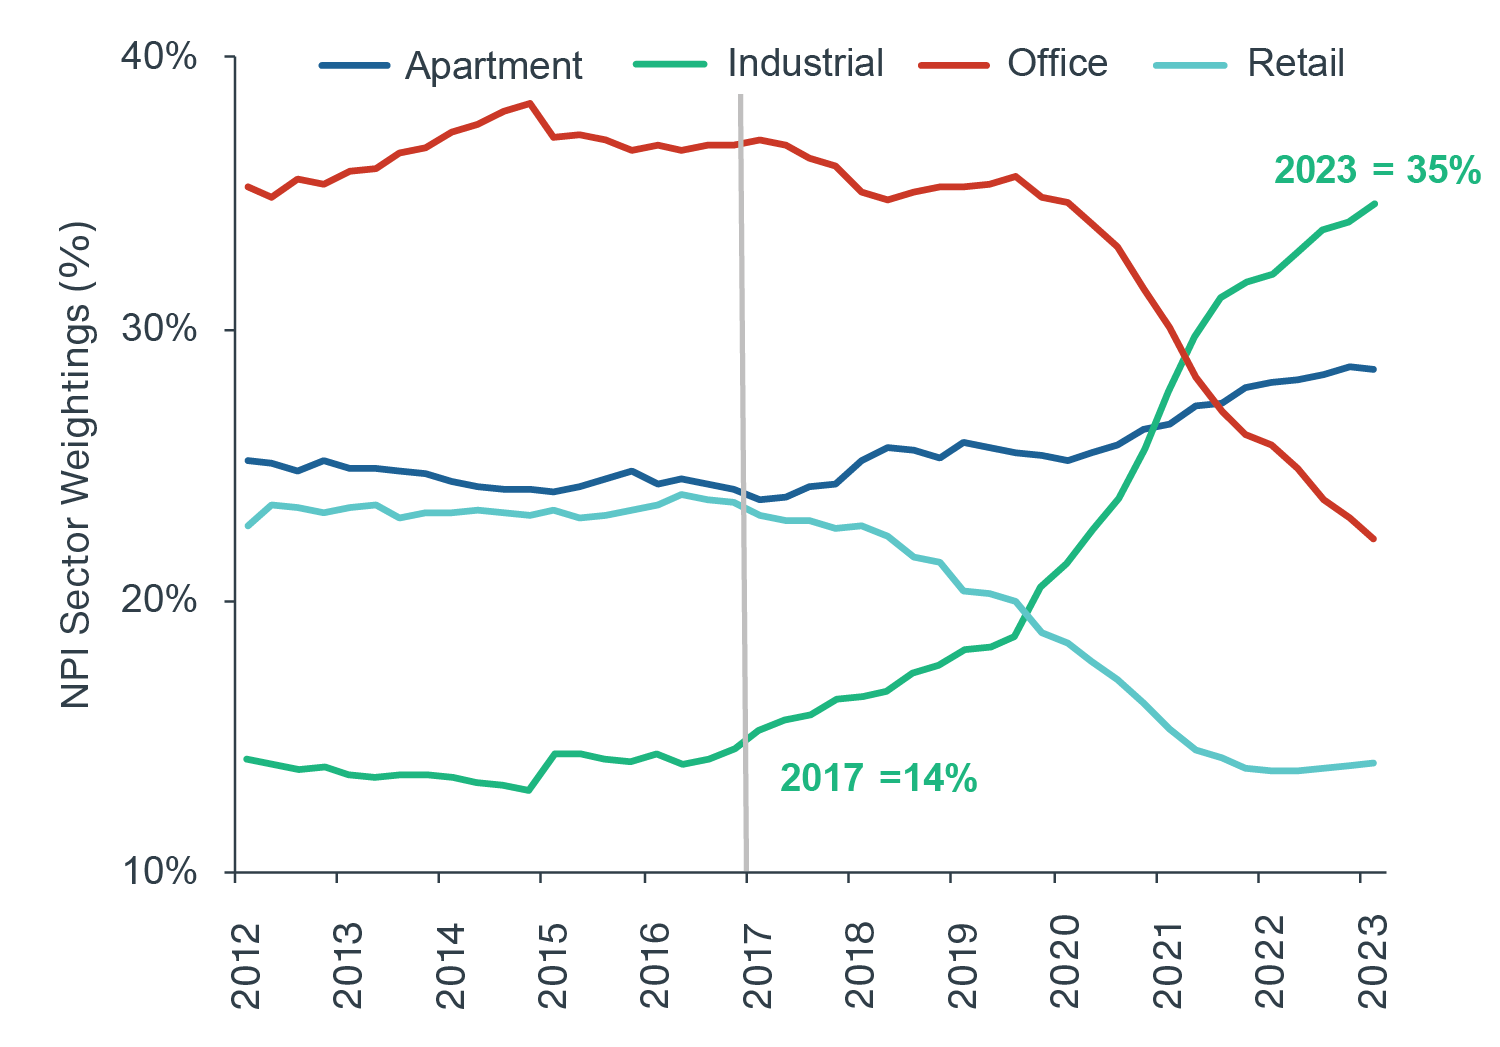
Source: NCREIF, Clarion Partners Investment Research, Q4 2023.
CRE FUNDAMENTALS UPDATE: 2024 TO 2028
Nationwide, industrial real estate rent levels have remained at record highs. While the U.S. industrial vacancy rate has risen to 5.7%, an increase from the all-time low of 2.9% in Q2 2022, it remains well below the long-term average (LTA) of 6.7% (Figure 3).2 Year-to-date, new construction starts have fallen significantly, which bodes well for the sector’s future outlook.3
FIGURE 3: U.S. INDUSTRIAL VACANCY RATE HISTORY/FORECAST
& ANNUAL RENT GROWTH HISTORY
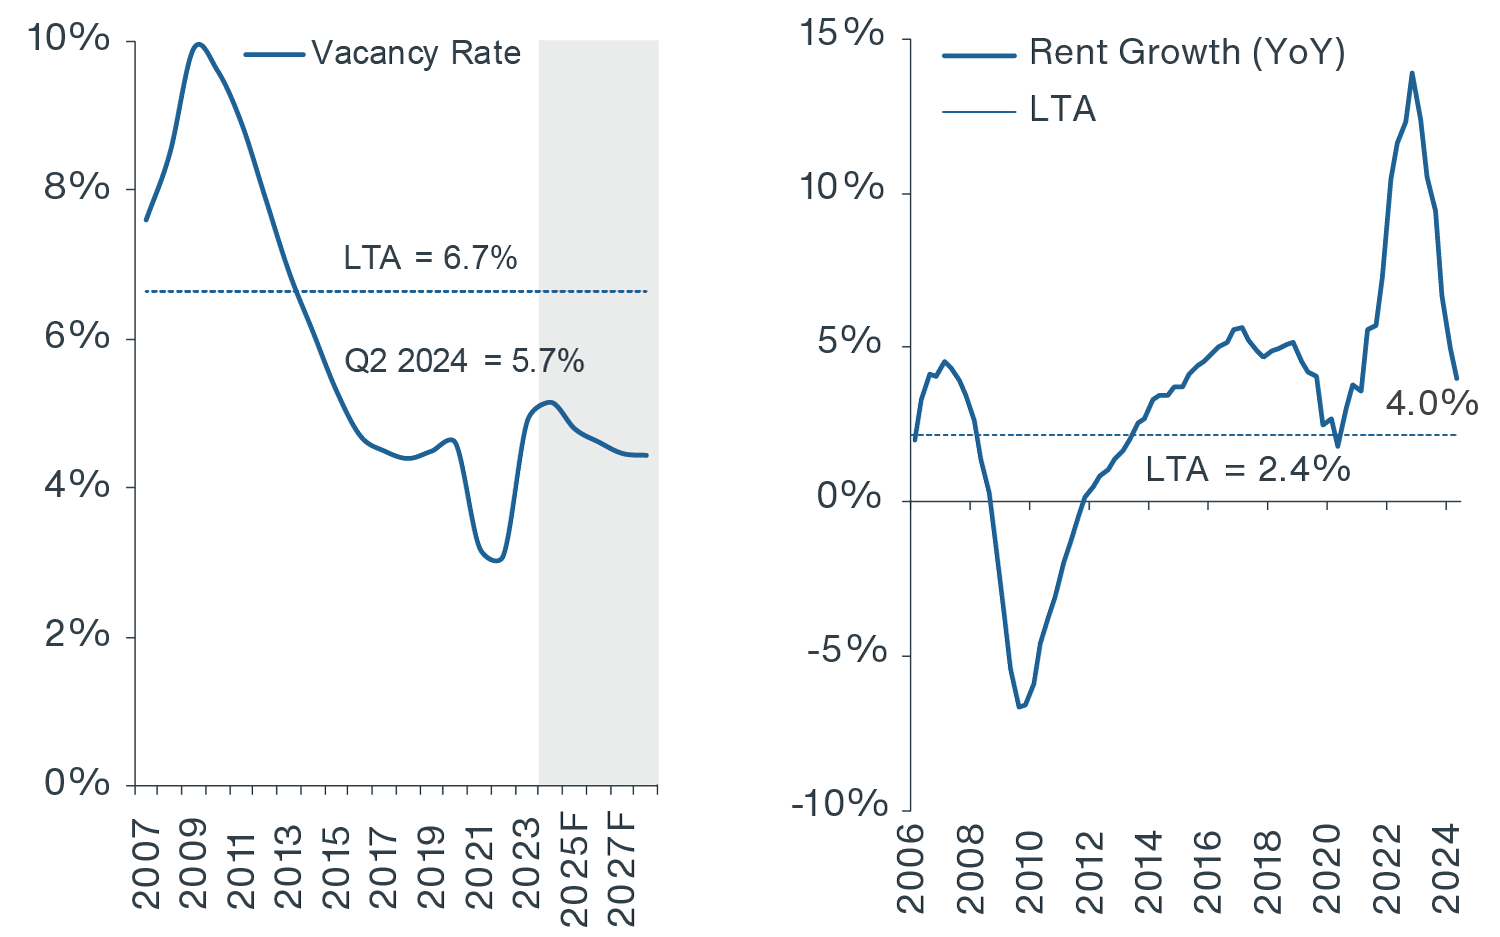
Source: CBRE-EA, Clarion Partners Investment Research, Q2 2024.
Looking ahead, we anticipate:
-
New Supply Moderating. Relative to recent years, new supply is expected to continue to moderate, which is likely to strengthen ongoing rent growth and absorption. From 2024 to 2028, new construction as a percent of stock is forecasted to fall to 1.7%, below the 5-year historical average of 2.3%.4
-
Vacancy Will Remain Low. Over the past few years, vacancy rates have largely remained below the LTA in most markets. Through 2028, the U.S. industrial vacancy rate is expected to decline again (to about 4.4%), as new development slows (Figure 4).5
- Rent Growth Above LTA & Major Sector Average. Since 2021, rent growth has also stayed well above the LTA and is also projected to outperform most other property types over the next five years.
- Top Ranking NOI Growth. The sector is also forecast to have the highest ranking net operating income (NOI) growth of all the core and alternative sectors from 2024 to 2028.
FIGURE 4: U.S. INDUSTRIAL FUNDAMENTALS:
NET ABSORPTION, SUPPLY, VACANCY
& RENT GROWTH
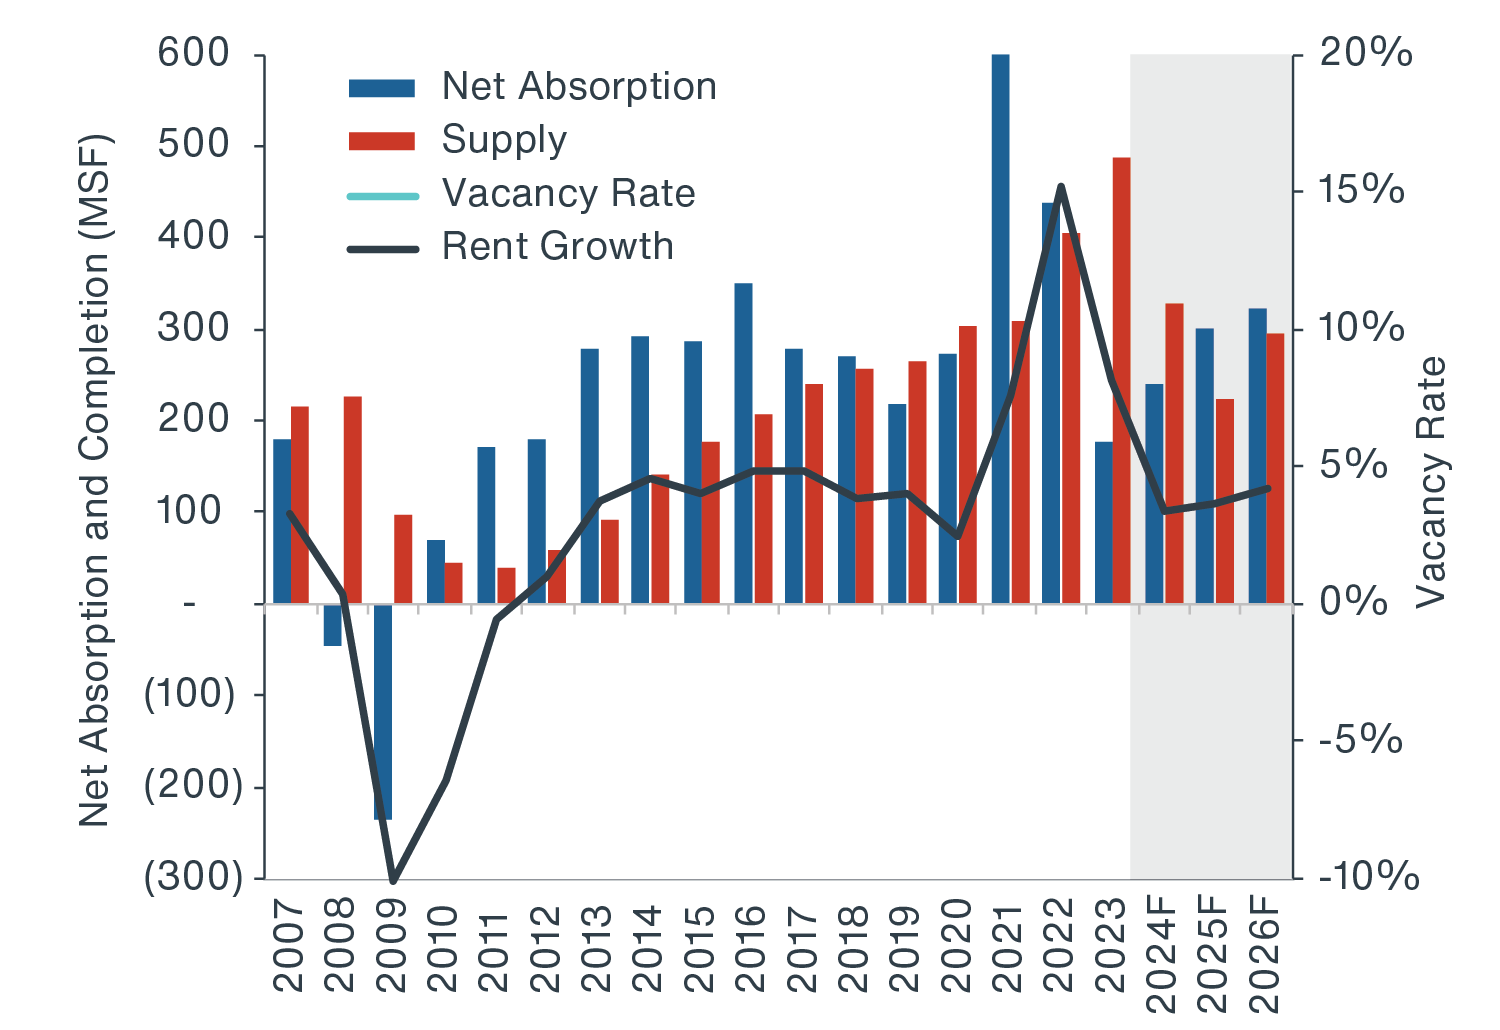
Source: CBRE-EA, Clarion Partners Investment Research, Q1 2024.
DEMAND DRIVERS
Over the past decade, demand for warehouse and distribution property has remained very strong with annual net absorption of over 200 million square feet almost every year. At the same time, overall industrial stock has risen by nearly 25%, with new construction (or Class A assets) driving much of this growth.6
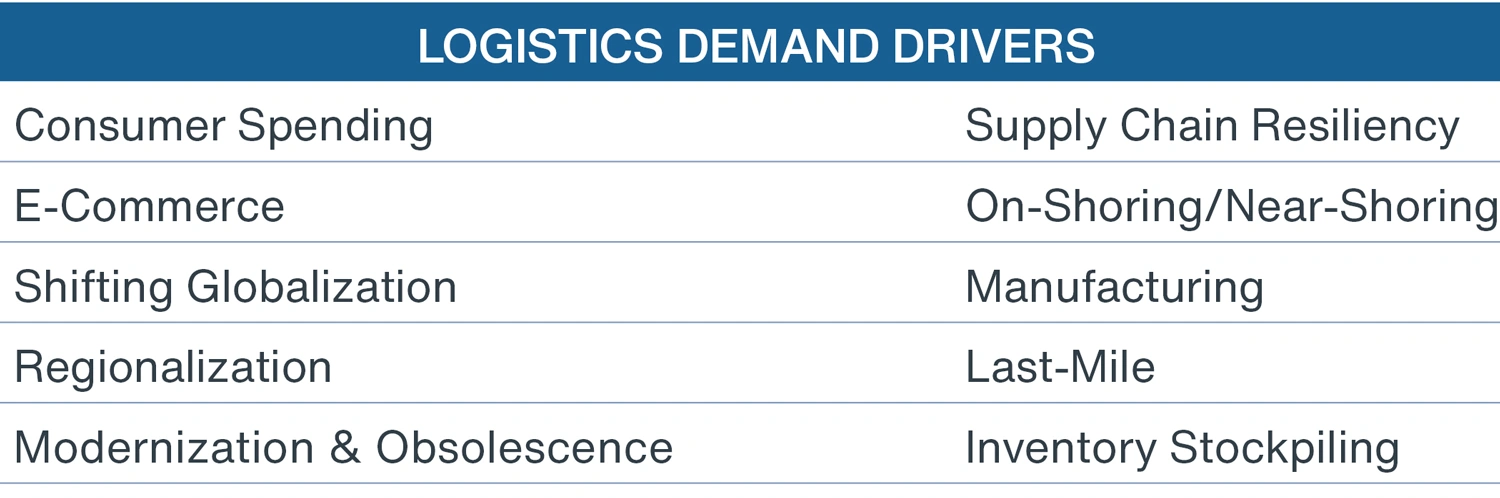
The demand drivers for industrial are structurally diverse as well. A few include: e-commerce, expanding global trade, more onshoring/nearshoring of manufacturing, and obsolescence (Figure 5). At this time, there is a significant need for high-quality facilities to accommodate the demand from occupiers looking for more modern facilities.
FIGURE 5: U.S. INDUSTRIAL DEMAND DRIVERS
Source: Clarion Partners Investment Research, July 2024.
More recent supply chain disruptions (post COVID-19 global pandemic) have impacted international logistics dynamics. More specifically, shifting globalization, building supply chain resiliency, greater ‘regionalization,’ and inventory stockpiling have all heightened industrial demand.
Additionally, there is now a domestic manufacturing boom underway, including a substantial increase in the onshoring of factories and assembly activities (Figure 6). Nearly $1.0 trillion has been invested in U.S. production across major industries, which will certainly continue to boost new leasing and space requirements throughout these regions.7
FIGURE 6: DOMESTIC MANIFACTUING BOOM: MAP OF RECENT ANNOUNCEMENTS
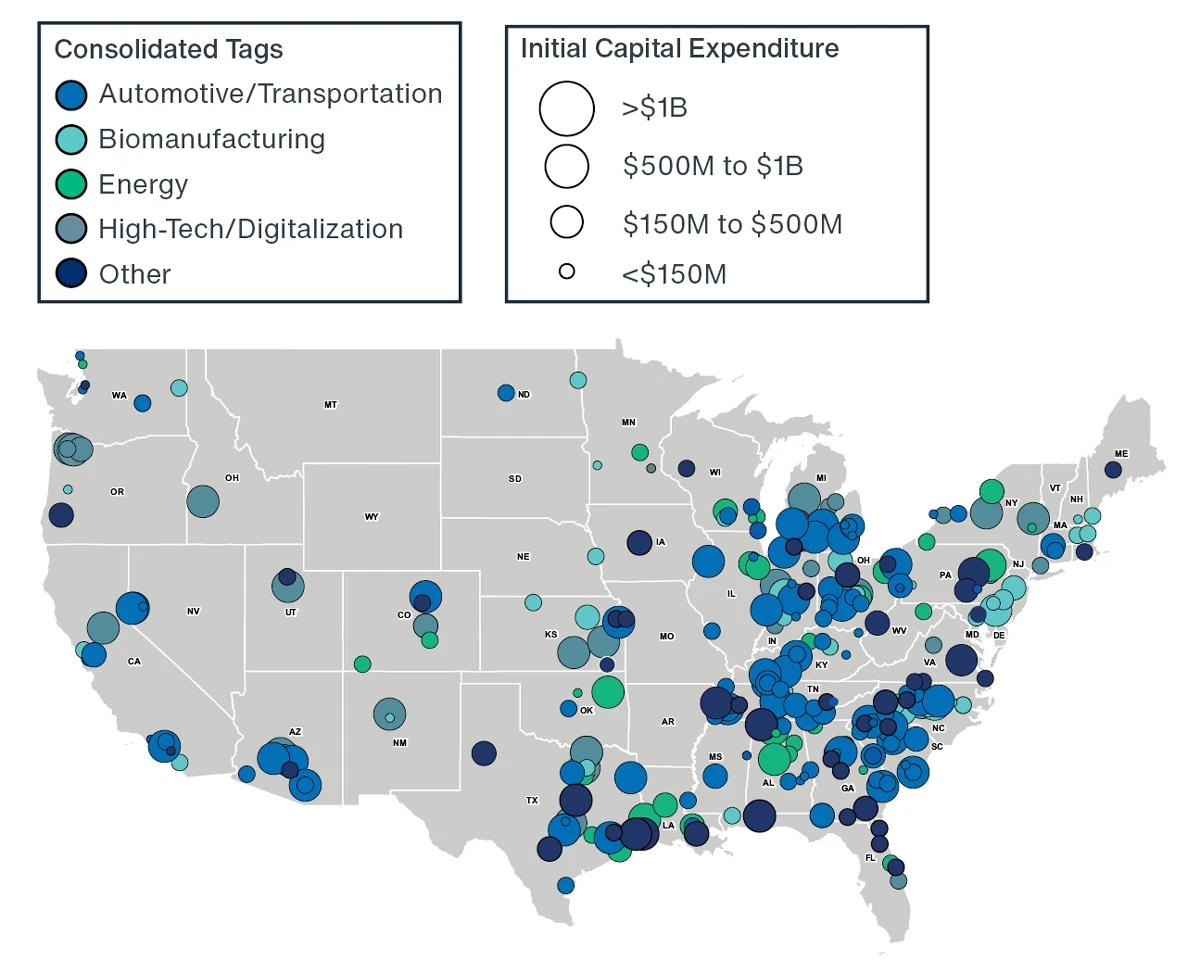
Source: Newmark Research, Newmark Global Strategy & Consulting, June 2024. Large investments have been made across the U.S. for new and expanding projects involving heavy industry, semiconductors, energy, electric vehicles, and biomanufacturing.
Over the next five years, the three greatest drivers for additional square footage are now expected to be: e-commerce, inventory stockpiling, and obsolescence. These factors combined are estimated to require an additional 1.1 billion SF (Figure 7).
FIGURE 7: ADDITIONAL INDUSTRIAL SQUARE FEET REQUIREMENTS: 2024F-2028F
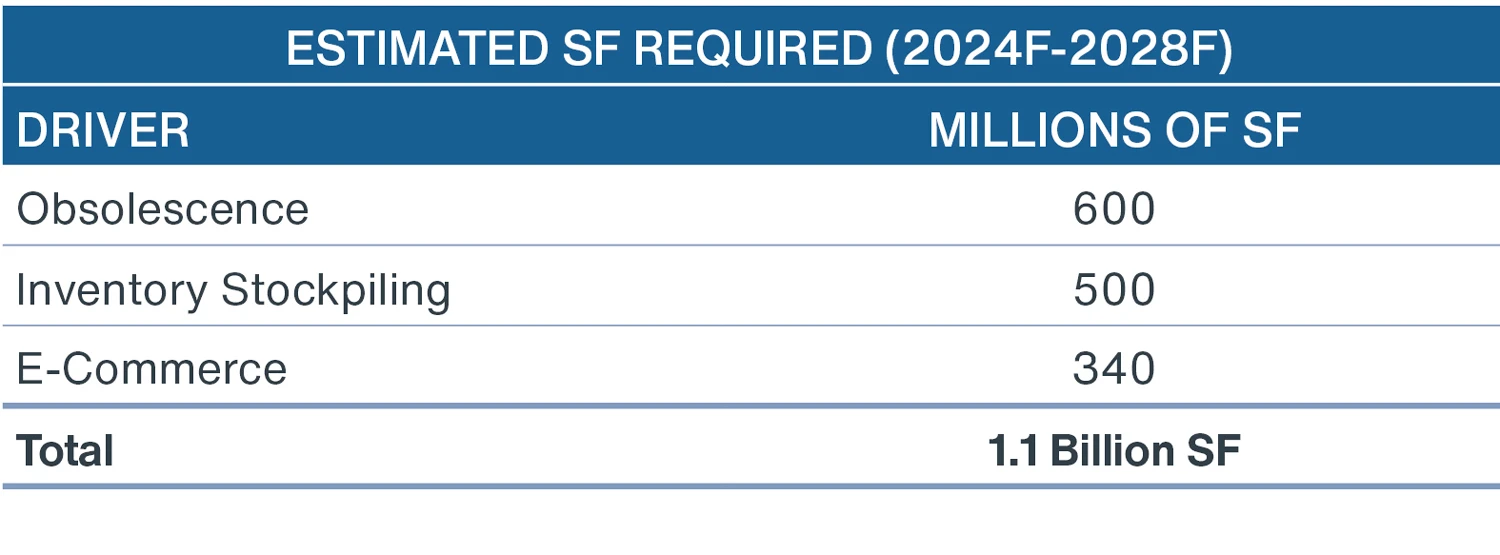
Source: Clarion Partners Investment Research, July 2024.
A GOOD ENTRY POINT
Clarion Partners believes that the current market dynamics present a good entry point to acquire logistics assets.
Increasing Investor Confidence. The Fed continues to signal that interest rates have passed their peak, which may prompt further easing of monetary policy in the months ahead, depending on incoming inflation data. Capital markets have shown cautious optimism, particularly in the context of the industrial sector, and we have seen greater liquidity and deal flow in 2024.
Stabilizing Valuations. Since the spring of 2022, industrial real estate has reported a more modest value decline relative to the NPI (-11.6% vs. -16.4).8 Overall, industrial property values now appear to be near the 'bottom', especially if interest rates continue to moderate with peak rates behind us (Figure 8).
Moderating New Supply. Year-to-date in 2024, new construction starts have fallen sharply following a record level of new supply in 2022 and 2023. New supply forecasts remain subdued in 2025 and 2026, which is likely to support rent growth.
FIGURE 8: NPI MARKET VALUE INDEX: NPI VS. INDUSTRIAL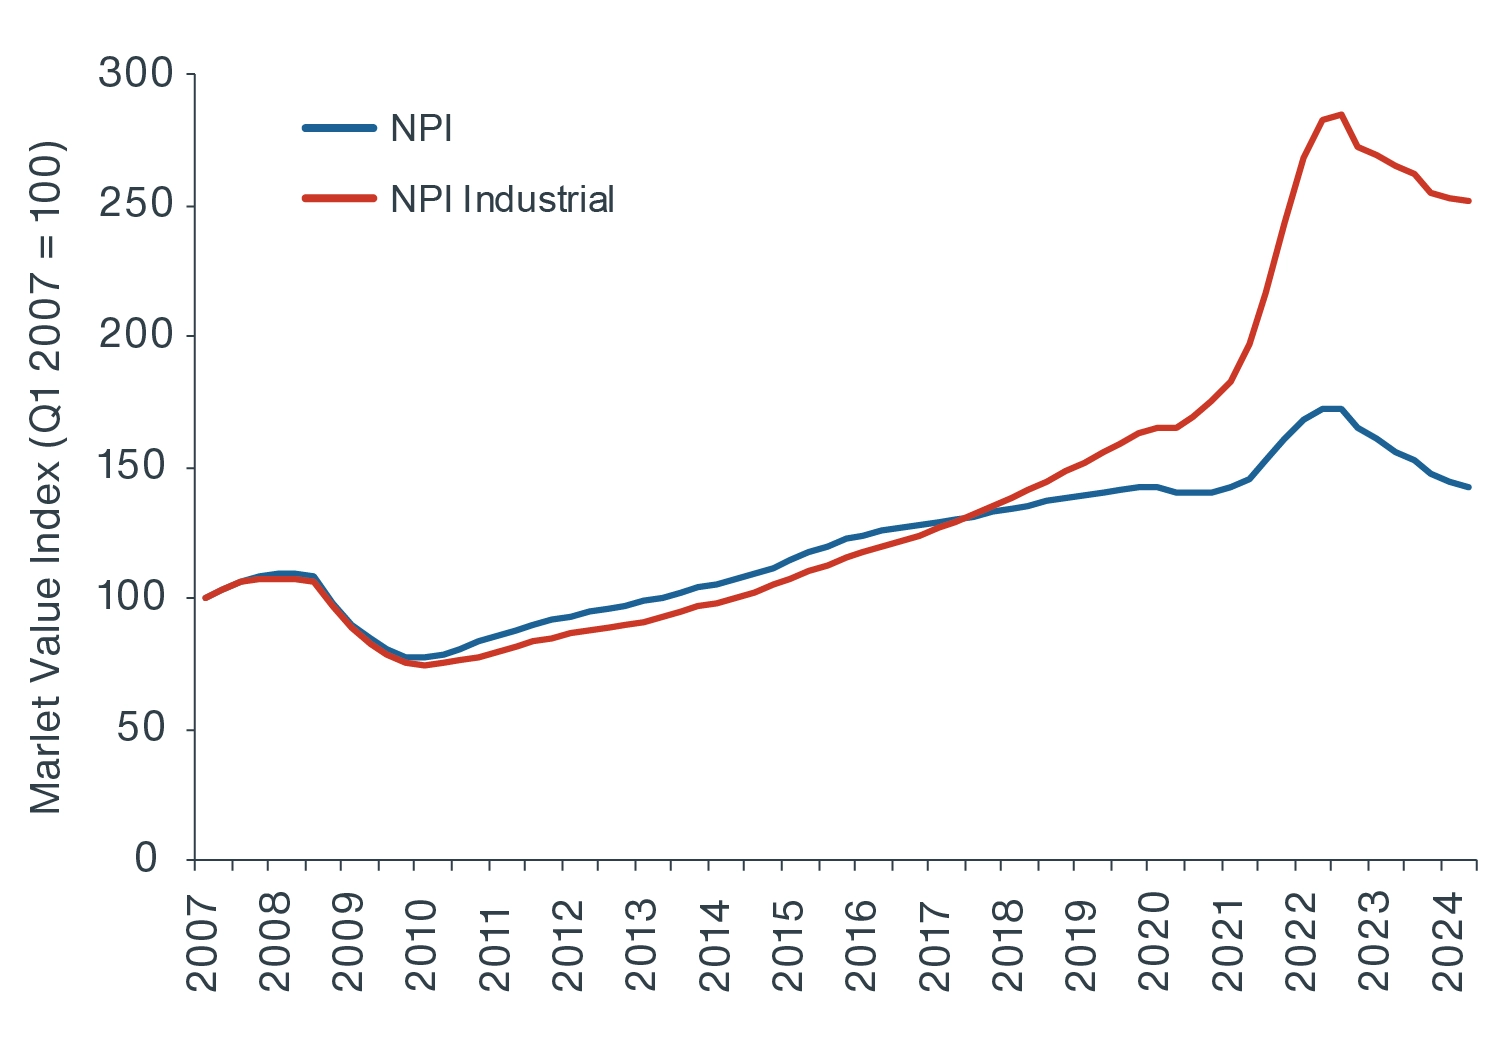
Source: NCREIF, Clarion Partners Investment Research, Q2 2024. Note: Based on the Expanded NPI.
At this time, we recommend the following tactical investment and management strategies:
-
Seizing Opportunities Presented by Market Dislocation. The recent repricing has opened a unique chance to acquire high-quality assets at a significant discount compared to replacement cost.
-
Focus On Asset and Location Quality. In the short term, we anticipate a wider range of performance at the asset level due to the normalization of market fundamentals. This calls for a more selective approach to asset selection.
-
Maximize Operational Performance. As we enter this new cycle, investors should pay even greater attention to the operational performance of their assets to drive returns given uncertainty surrounding terminal rates and debt costs.
INVESTMENT OPPORTUNITIES
Currently, we are focused on the following opportunities in the industrial and logistics landscape.
-
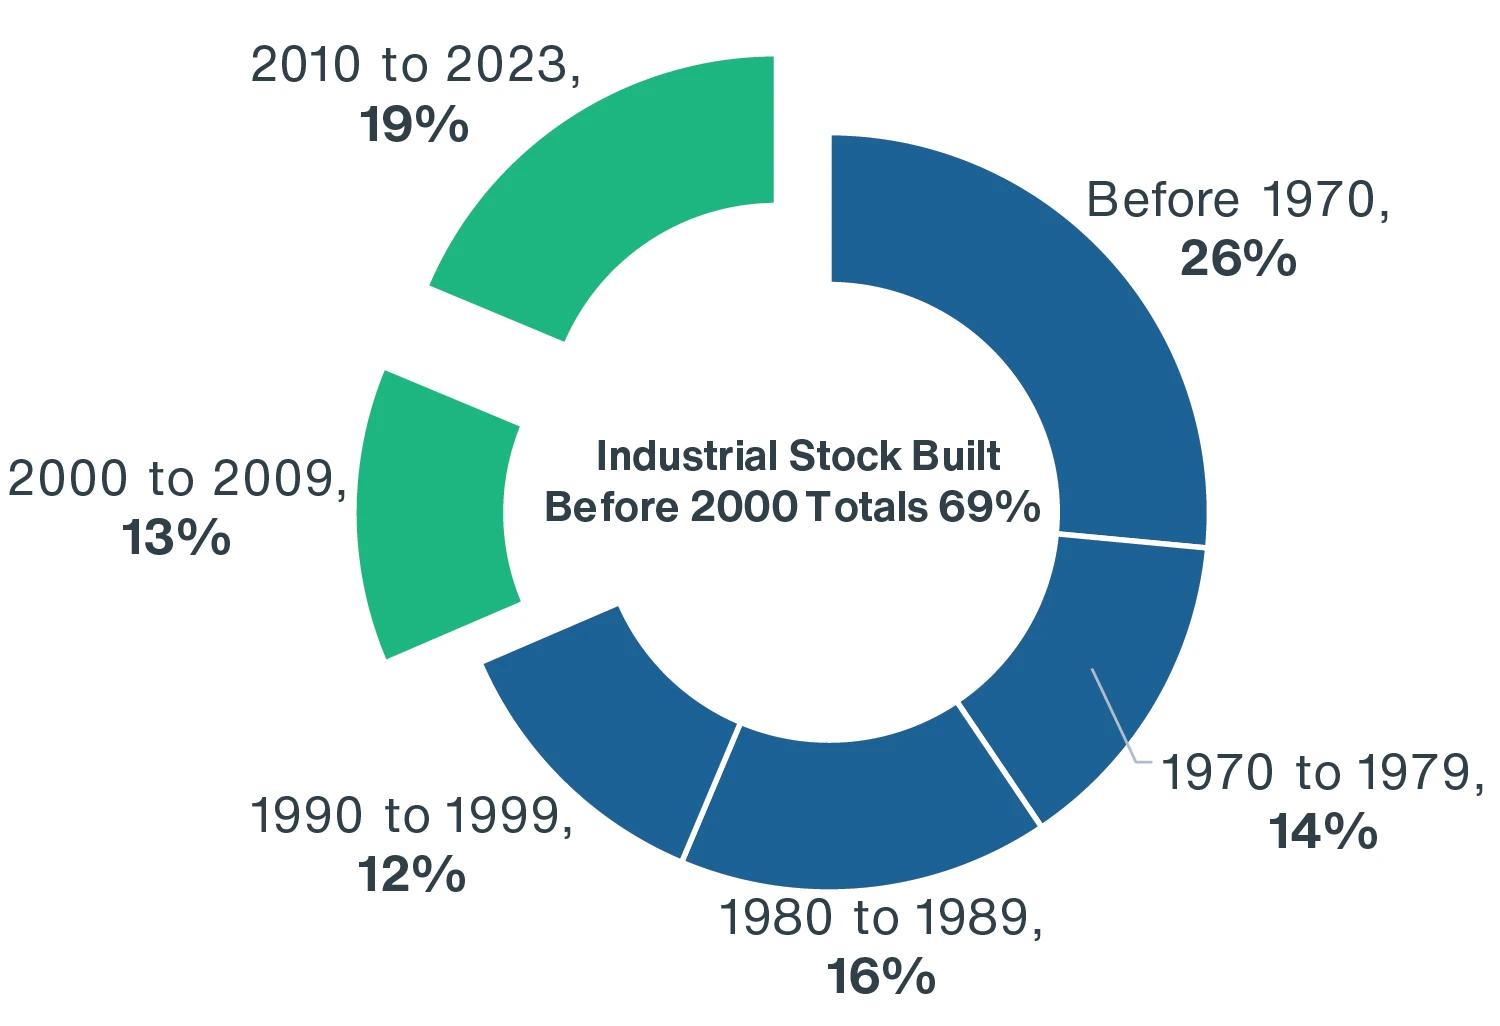
Class A Stock. About 70% of existing industrial stock was built before 2000 (Figure 9). Class A stock warehouse accounts for less than 20% of total industrial assets; however, class A inventory has accounted for 70% of total industrial net absorption since 2018.9 Updating the widespread functional obsolescence at existing buildings presents a sizable opportunity, especially in many large U.S. cities, where vacant land is both scarce and expensive.
FIGURE 9: INDUSTRIAL STOCK BY BUILDING YEAR BUILT
Source: CBRE-EA, Clarion Partners Investment Research, Q1 2024.
-
Last-Mile Facilities. E-commerce as a share of total retail sales is expected to rise from around 20% now to about 35% by 2035 (based on annual growth of 5% to 10%).10 E-commerce utilizes three times more warehouse space than traditional retail. Clarion Partners expects that another 340 million SF will be required to meet online sales fulfillment alone. Smaller ‘light’ industrial properties closer to the end consumer serving the ‘last mile’ often command a rent premium.
-
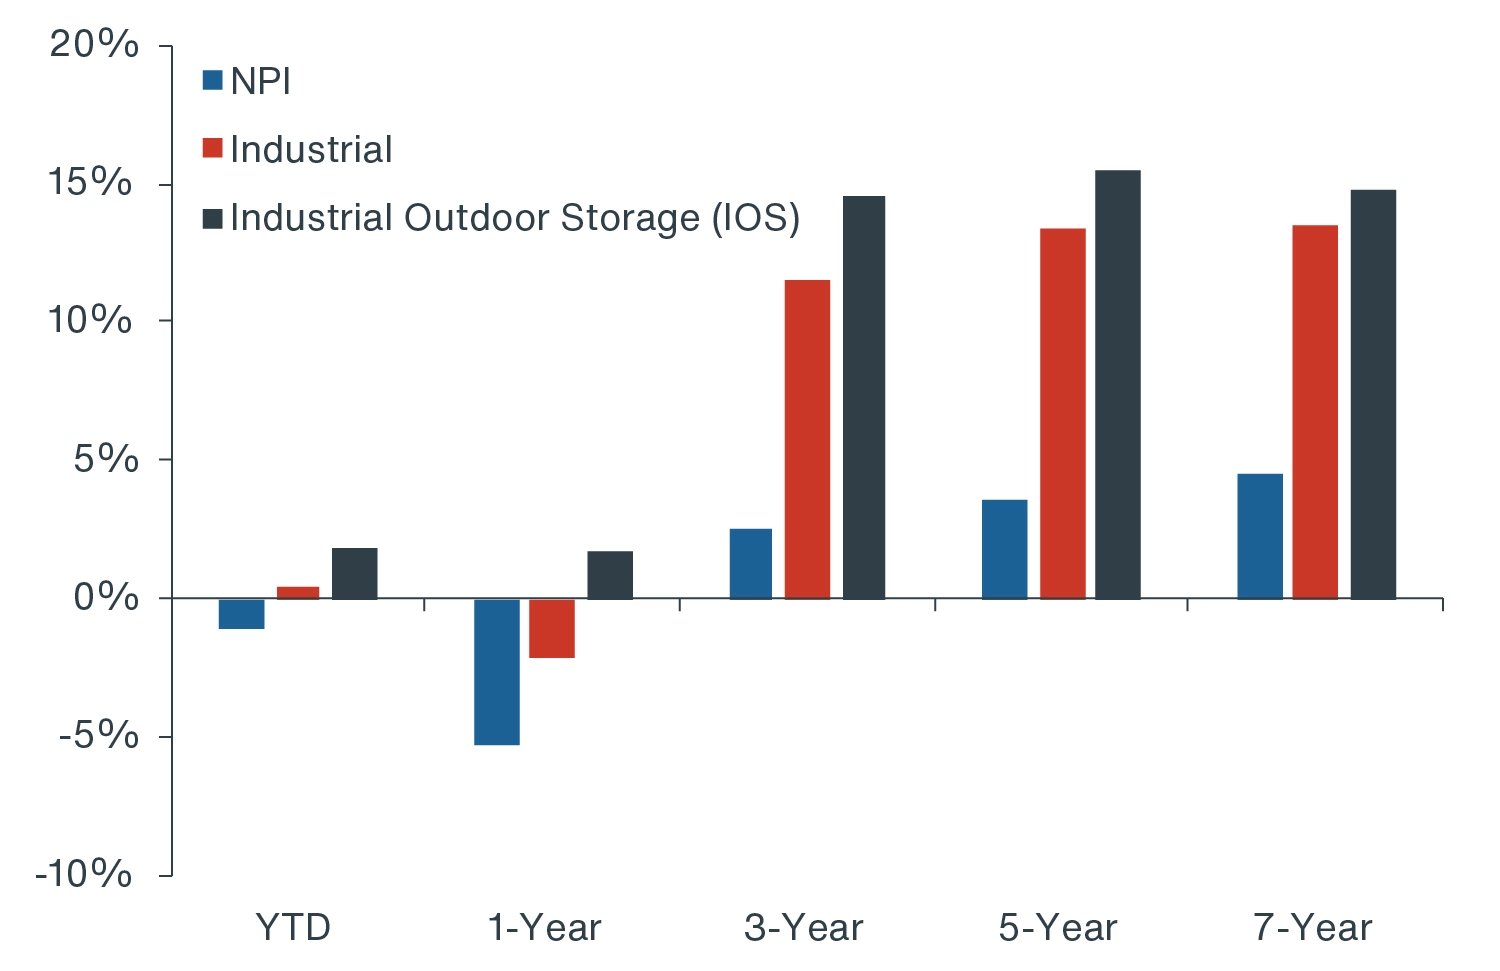
Industrial Outdoor Storage (IOS). IOS has emerged as a specialized and high-performing industrial subtype serving logistics distribution.11 The NPI ‘IOS’ subtype has beat out the industrial average and overall NPI total return over all time frames (Figure 10).
FIGURE 10: NPI VS. INDUSTRIAL SUBTYPE TOTAL RETURN HISTORY
Source: NCREIF, Clarion Partners Investment Research, Q2 2024. Note: Based on the Expanded NPI.
KEY CONSIDERATIONS & RISKS
The global COVID-19 pandemic spurred historic demand for industrial real estate due to the surge in e-commerce, as lockdowns prevented the movement of people. This led to unprecedented appreciation, rent growth, and very low vacancies nationwide. Since 2020, U.S. industrial effective rents have grown by 40%.12
Over the past two years, the sector has returned to more typical, pre-2020 demand levels relative to the pace of the last four years. Going forward, we see the following as key considerations and potential risks:
- The completion of the recent surge in supply;
- More moderate rent growth; and,
- Capital markets uncertainty.
However, the pace of new supply is diminishing rapidly given expensive development financing, higher construction costs, and lengthy entitlement and permitting processes in many jurisdictions.
Year-to-date in 2024, NOI and rent growth have remained very strong and are expected to re-accelerate and be above the CRE sector average in the years ahead.13
CONCLUSION: U.S. INDUSTRIAL OUTLOOK - LIKELY TO OUTPERFORM FROM 2024-2028
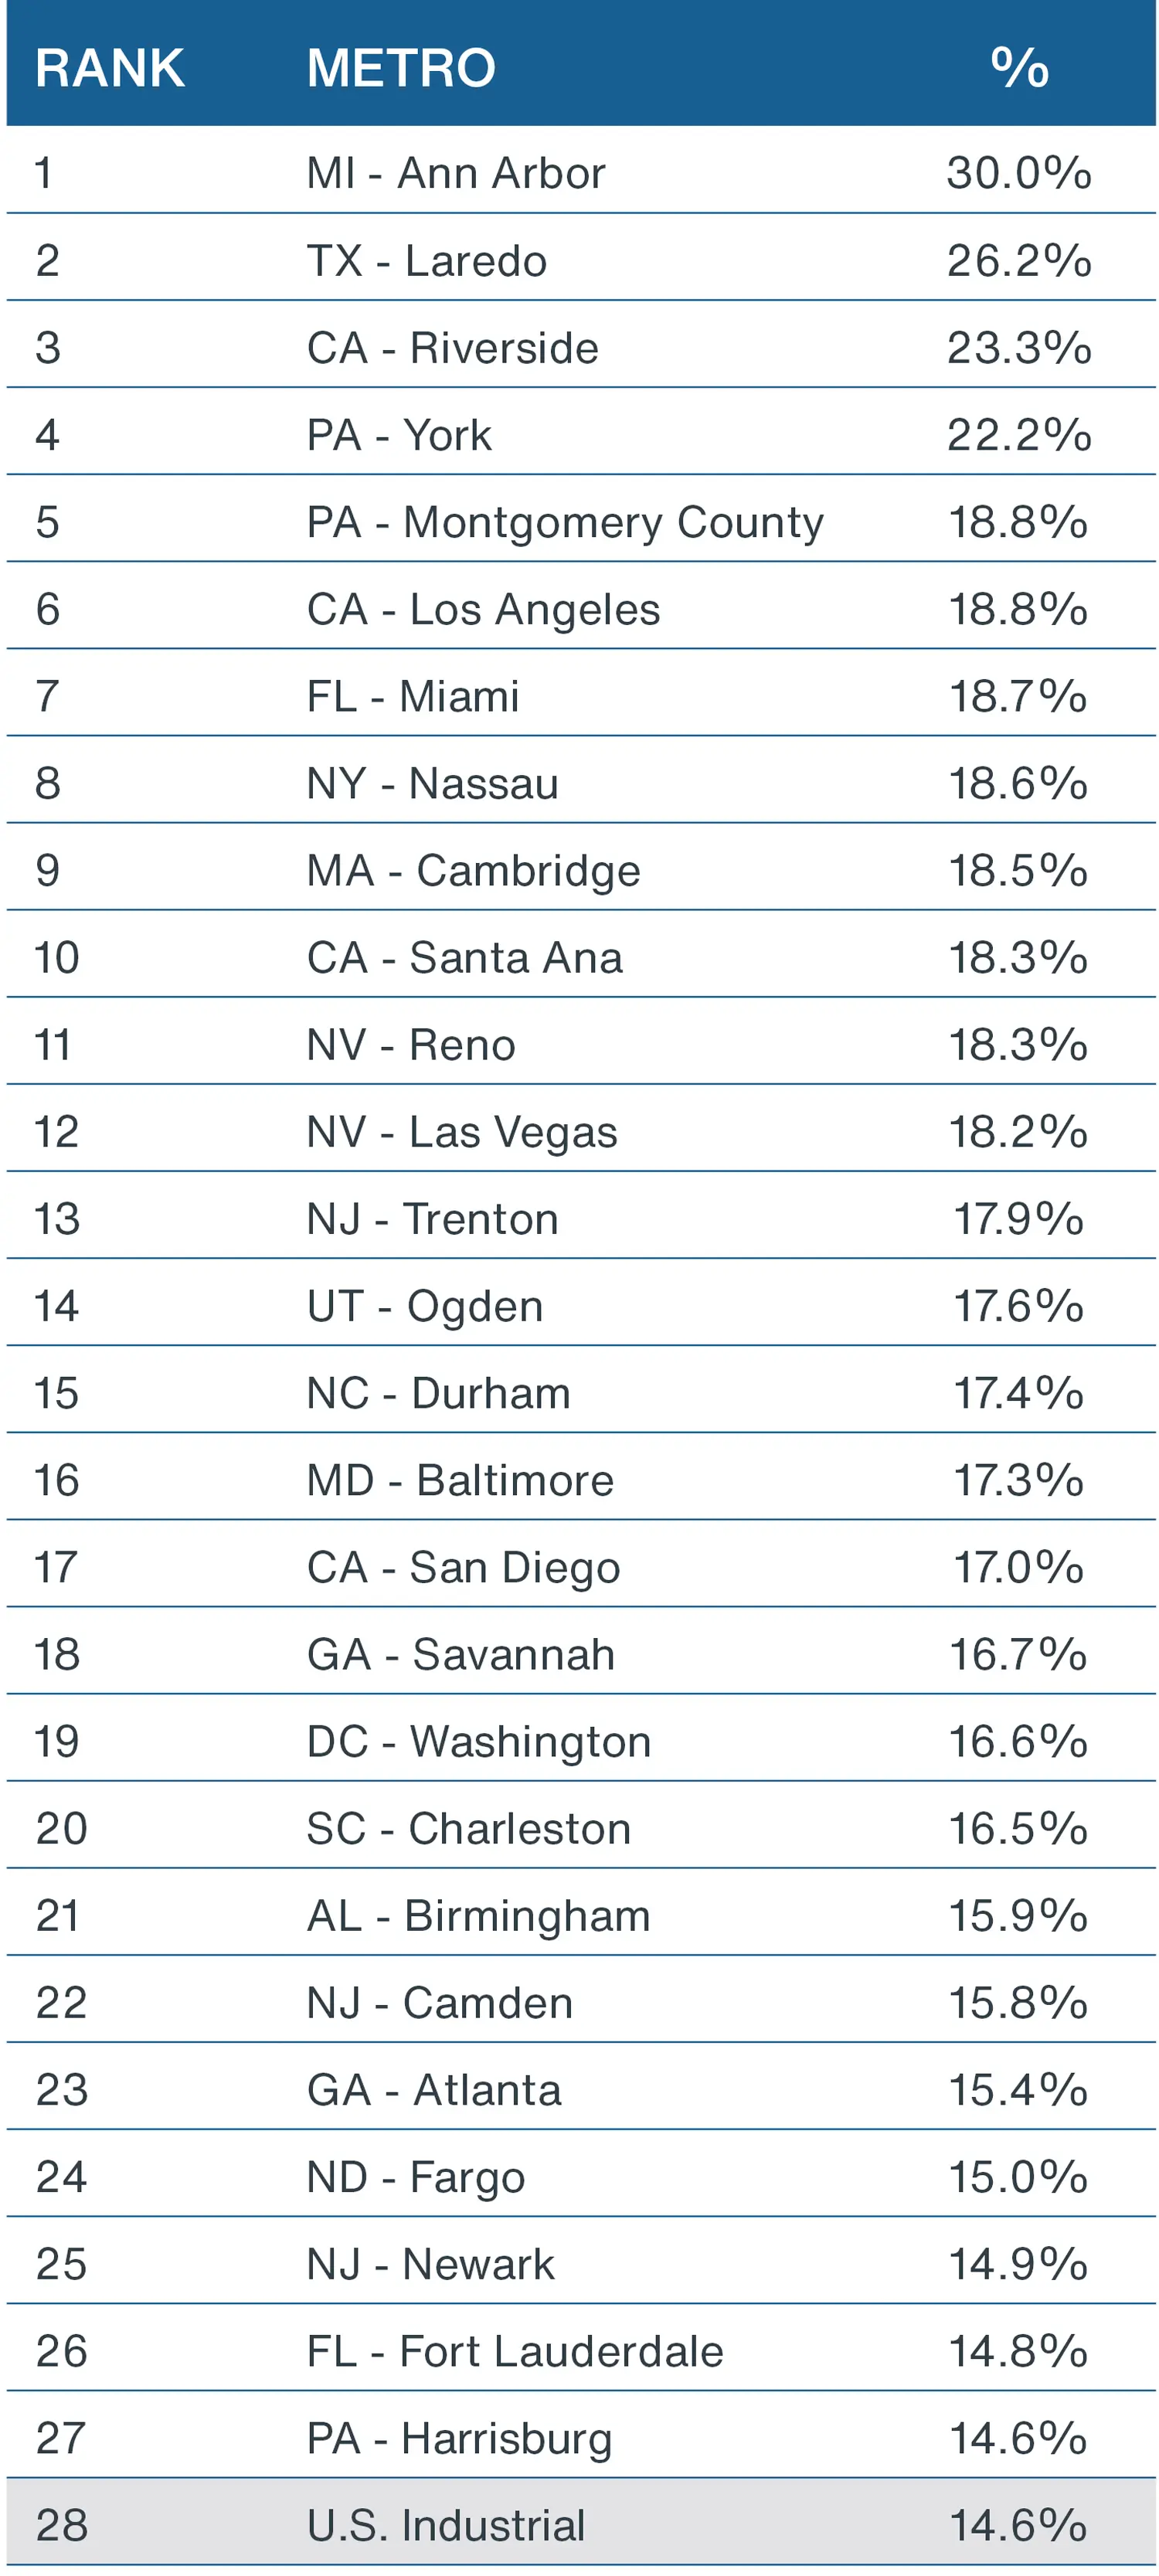
Clarion Partners anticipates industrial will continue to be a top-performing CRE sector due to powerful and durable long-term demand catalysts. It has had an extraordinary decade-long boom with most markets reporting double-digit annualized returns (Figure 11).14
Furthermore, the PREA Consensus Survey forecasts that industrial will continue to outperform the major sector average from 2024 to 2028 (Figure 12). The enduring strength of omni-channel consumption in an increasingly interconnected global economy will continue to drive steady demand at new and existing warehouse and distribution properties across the U.S.
FIGURE 11: INDUSTRIAL INVESTMENT PERFORMANCE: 3-YEAR TOTAL RETURN BY METRO
Source: NCREIF, Clarion Partners Investment Research, Q1 2024.
FIGURE 12: PREA CONSENSUS TOTAL RETURN FORECAST (2024F-2028F)
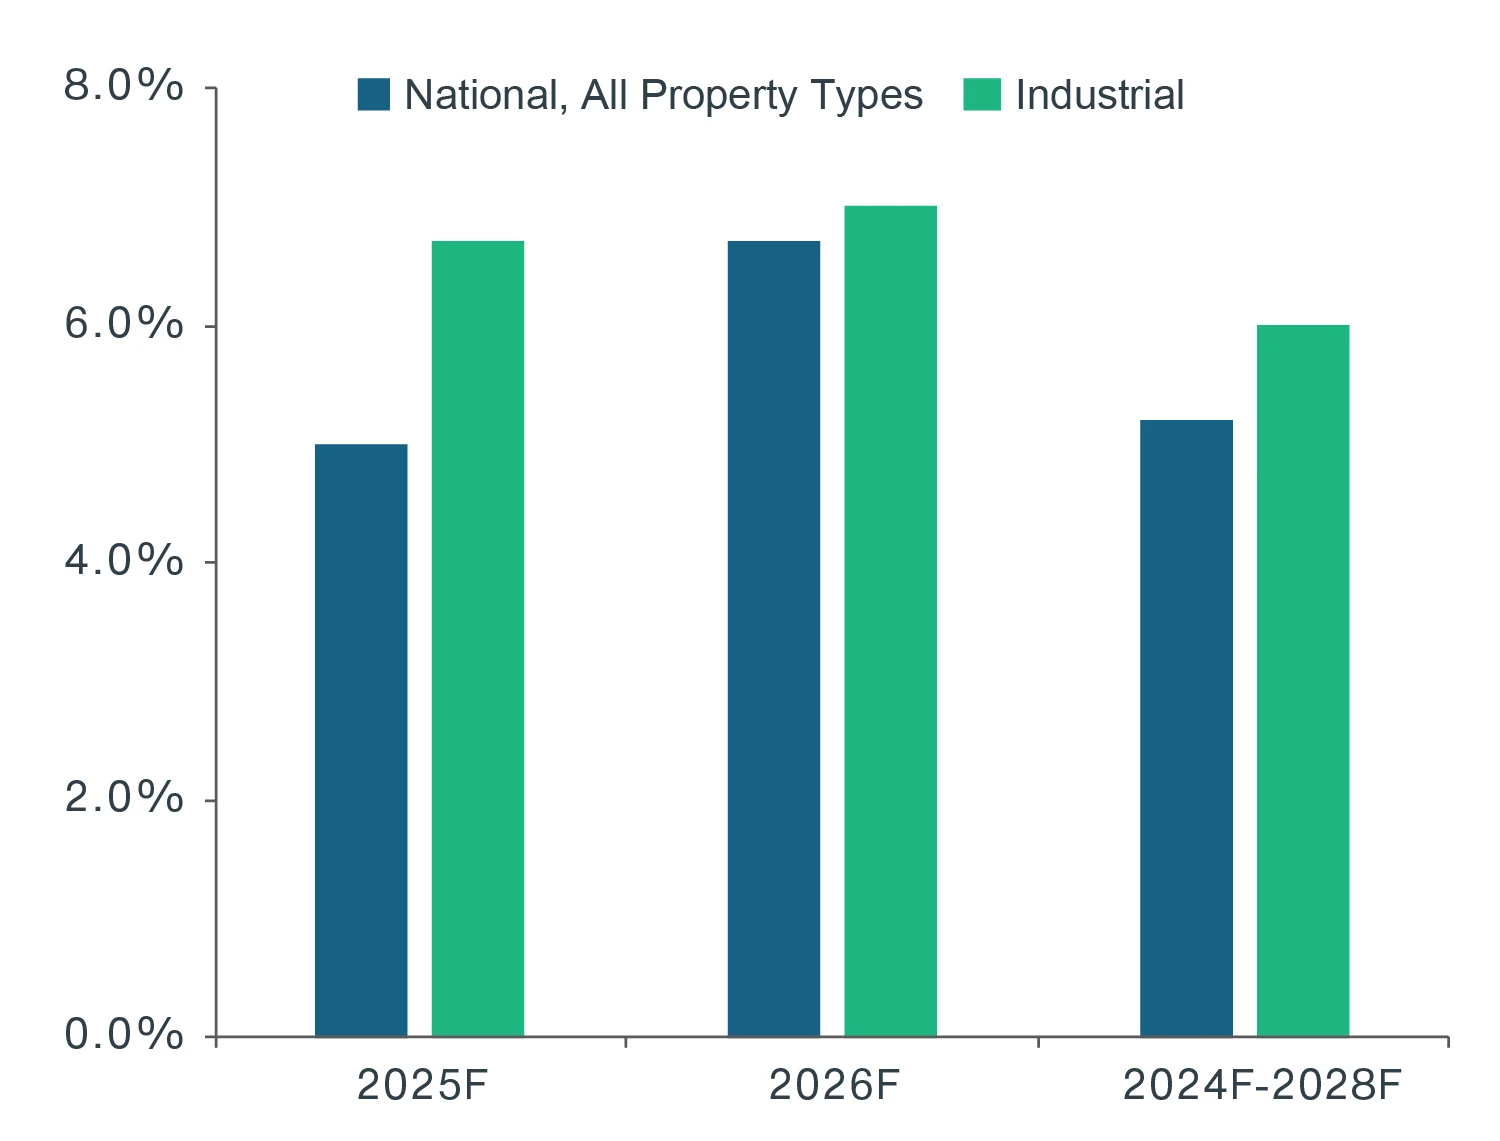
Source: PREA, Clarion Partners Investment Research, Q1 2024. Note: Major sector average includes apartment, retail, office, and industrial.
To learn more about the latest Trends in U.S. Industrial Real Estate, please click here to watch our Clarion Calls video series.