us-tariff-dilemma.pdfTHE 2025 TARIFFS: WHAT IS ON THE TABLE
On April 2nd, the Trump administration declared a national emergency and announced a sweeping raft of tariffs, which it had promised as part of its election campaign. A baseline tariff of 10% went in effect on all imports into the U.S. with additional tariffs tailored to individual countries on a “reciprocal” basis at an average rate of 28%. The tariffs are part of a stated strategy to rebalance trading relations and penalize countries with a surplus of exports to the U.S. Other aims are to accelerate investment into the U.S., raise revenue for additional economic pursuits or offset tax reductions elsewhere, and expand strategic autonomy for certain industries of national importance. With fast rising tensions, China is a notable outlier thus far, having been targeted with far greater tariffs and retaliating with higher tariffs of its own. Still, we expect tariff rates could look different when the dust eventually settles.
Reports indicate that many countries have started negotiating and offering concessions to reduce their tariff burden, but none have been announced or finalized to date. Those that did not retaliate like China saw a 90-day pause on reciprocal tariffs only a week after going into effect. More recently, tariff exclusions were granted for smartphones, computers, and other electronics – which make up a significant share of U.S. imports and largely come from China and Mexico. This has been received as a significant concession and as a sign that President Trump is willing to negotiate despite his stern public messaging and determined expectations to shift trade balances at all costs. For reference, the U.S. had a 2024 net trade deficit of $1.2 trillion from the trade of goods.1 Figure 1 offers an illustration of which sectors could be most directly affected by tariffs depending on import volumes by county. Electronics & machinery, chemicals, plastics, & leathers, auto & related industries, minerals, oil, cement and agriculture are most exposed.
FIGURE 1: THE COMPOSITION OF U.S. IMPORTS BY LARGEST TRADE PARTNERS (GOODS)
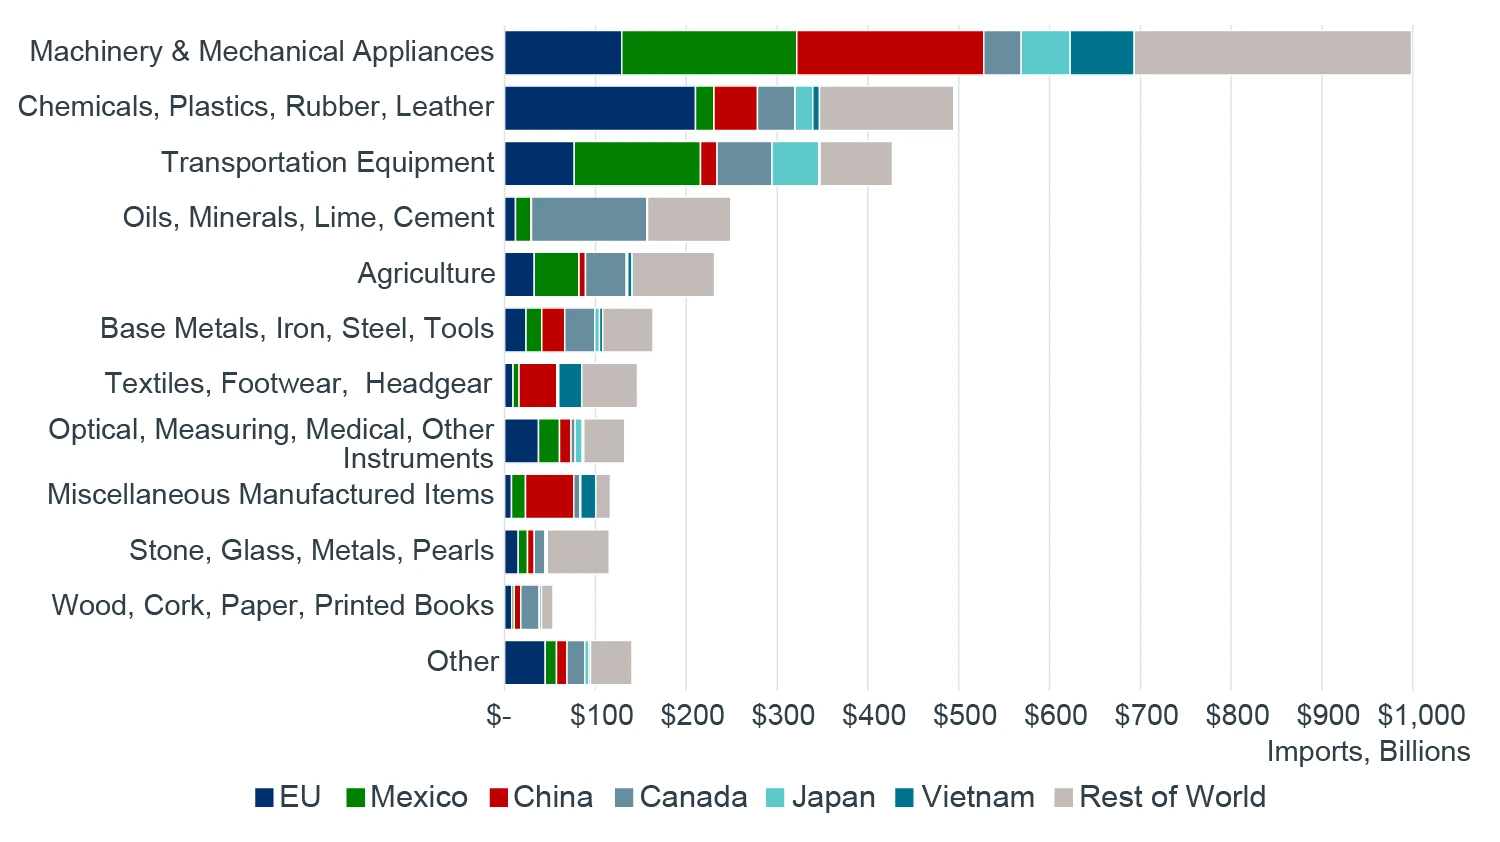
Source: U.S. Census Bureau, Clarion Partners Global Research, April 2025.
NOT THEIR FIRST RODEO
Today, Mexico is the largest source of imports into the U.S. while Canada is third. Canada and Mexico are also the two largest destinations of U.S. exports, both more than twice as large as those flowing to China. Mexico and Canada were spared from reciprocal tariffs on April 2nd, and the active 25% baseline tariff on those countries affects only non-United States–Mexico–Canada Agreement (USMCA) imports, excluding autos, thus shielding a great share of their exports. This could also be seen as acknowledgement of the strong economic interdependencies between the three countries, as their trade supports 13 million jobs in the U.S. A prime and mature example of this is the large and deeply intertwined automotive sector, which generates over 5 million jobs across North America. A scenario where the U.S. tries to cut ties with Mexico and bring auto production back to the U.S. seems unfeasible. Industry estimates suggest that companies would need to invest more than $50 billion across 18 new plants to meet the current auto production in Mexico.2 This does not factor in the many tiers of suppliers, the 2-to-3-year timeframe for a new plant to come online, and the hundreds of thousands of positions to fill – making the task extremely challenging and costly.
Mexico and Canada experienced similar turbulence while renegotiating NAFTA during the first Trump presidency. Despite the tense back and forth, concessions were reached under the rebranded USMCA trade pact that included a much higher share of U.S. components for autos (now 75%). Along these lines, both Mexico and Canada have quickly allocated resources to address the illicit flow of drugs, contraband, and illegal immigration issues which have been highlighted as the primary rationale for the new tariffs. While a sign of constructive progress, these issues will likely remain a priority into 2026 when the USMCA deal will be reviewed by all three nations.
CHINA SITUATION
Tensions with China, however, continue escalating. While President Trump claims to have a good relationship with President Xi, China’s perception as a potential economic and political competitor to the U.S. has grown. China saw tariffs during the first Trump administration, which were held in place and even expanded at certain points by former president Biden. This has already caused a substantial decoupling between the world’s largest manufacturing and consuming superpowers – see our previous paper for analysis on this topic here: Navigating Tariff Risks in U.S. Industrial and Logistics. Tensions are now escalating further, with China facing a shocking 145% tariff rate of on all goods (excluding, at least temporarily, chips, cellphones, and semiconductors); this building on top of previous economic sanctions and export controls largely targeting China's semiconductor industry. These restrictions aim to limit China's access to advanced chips and the technology needed to manufacture them. China has responded with retaliatory tariffs of 125%. This adds further friction and reduces the likelihood of reaching a deal for the return of free-flowing trade anytime soon. China remains the second largest source of imports into the U.S. today, but has lost nearly 9% share since 2017, which represents the highest dollar value loss of trade for any country. At the same time, Mexico and other East and Southeast Asian countries, including Vietnam and Taiwan, have more than made up the shortall.3 China also has the largest trade deficit (or export surplus) of around $300 billion, representing 25% of the total U.S. trade deficit.
FIGURE 2: LARGEST GLOBAL TRADE PARTNERS, U.S. (GOODS)
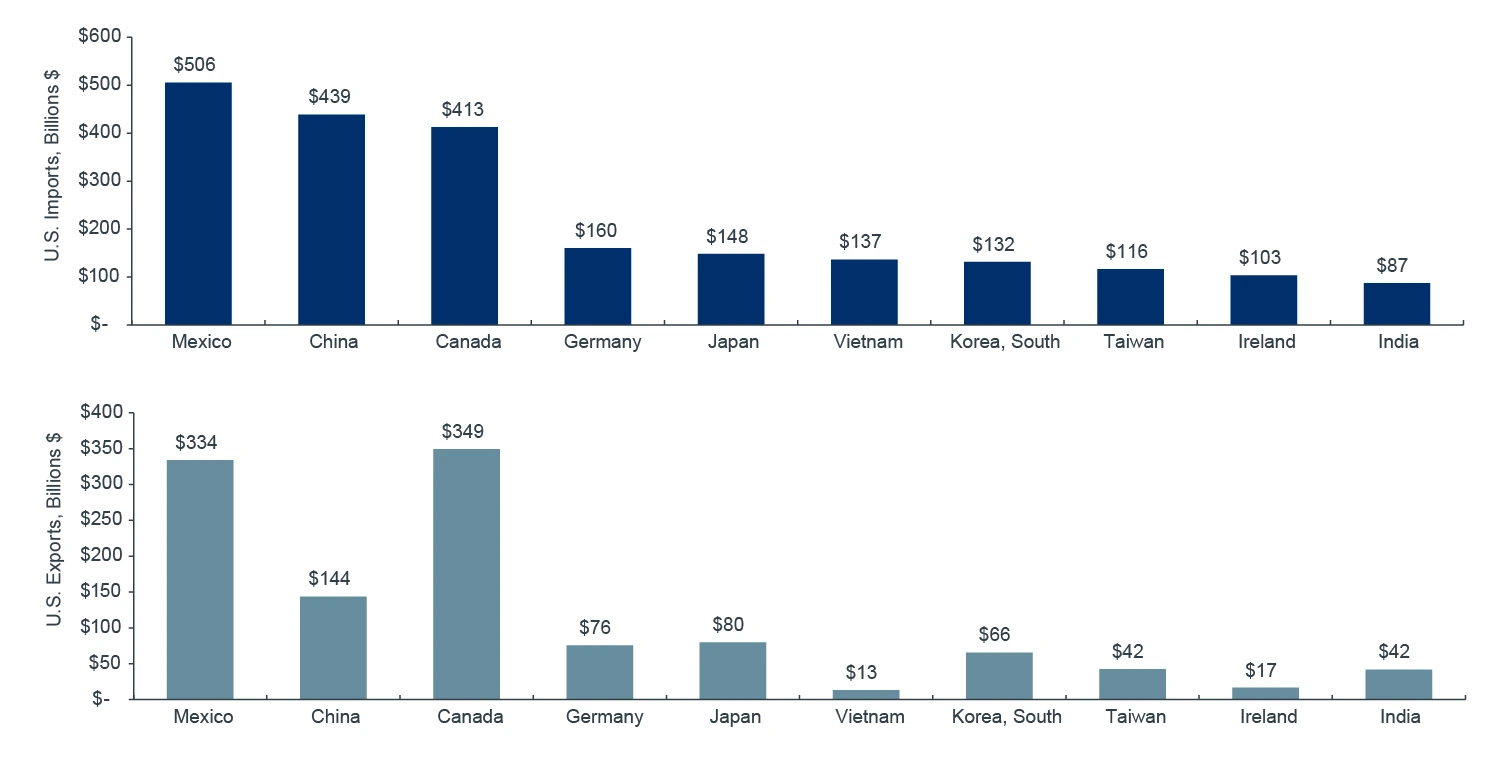
Source: CBRE, IPF, Clarion Partners Global Research, February 2025.
FIGURE 3: THE COMPOSITION OF U.S. EXPORTS BY LARGEST TRADE PARTNERS (GOODS)
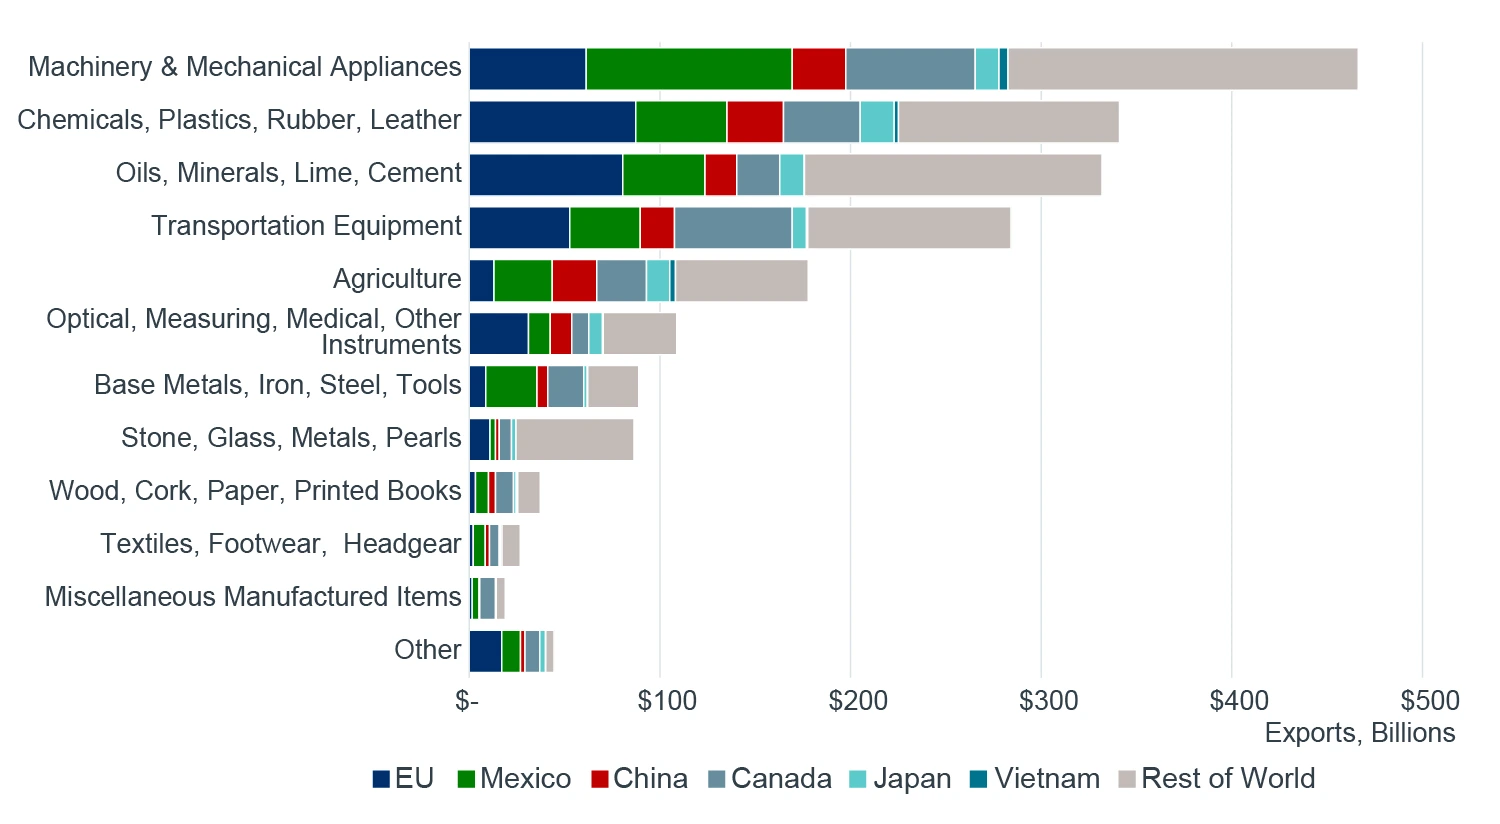
Source: U.S. Census Bureau, Clarion Partners Global Research, April 2025.
THE EMERGENCE OF SOUTHEAST ASIA AND IMPORTANCE OF THE EU
The regional importance of the European Union as a source, and destination, of U.S. trade, and the impressive growth of East and Southeast Asia (ex. China) as a China-alternative, deserves attention. When taken in sum, the EU accounts for 19% of imports into the U.S. while making up 18% of the U.S. export market. These goods are largely made up of commodities that include many intermediate goods and chemicals, as well as electronics and vehicles. East and Southeast Asia (ex. China) have seen flows to the U.S. increase more than 70% since 2017, making up a collective 23% share of U.S. imports. Nike, Adidas, Apple, and Samsung are recent examples of companies that have shifted production to places like Vietnam, elevating its importance as a volume supplier of U.S. goods. While this, too, has increased trade deficits and the possibility of tariffs, many of these countries remain competitive global manufacturing hubs and continue to offer a compelling business proposition while actively negotiating trade deals with the U.S.
For these reasons, we can assume that trade deals with Mexico, Canada, the EU should be a high priority and in the economic interest of the U.S. Countries in East and Southeast Asia should follow next, given their growing role as an alternative to China and their more friendly relations with the U.S.
IMPLICATIONS FOR INDUSTRIAL & LOGISTICS
In evaluating the potential impact on the industrial & logistics sector, we need to separate cyclical from structural drivers of demand.
- CYCLICAL IMPACTS
Tariffs are a one-time cost adjustment based on import value (often a fraction of retail prices), and empirical research suggests that a 10% tariff generally increases retail prices by about 1% over 12 months.4 While this reduces consumer purchasing power, they did little to curtail consumption during the first Trump administration given the strong dollar, falling commodity prices, and lower interest rates at the time. The economic situation in the U.S., while still fundamentally sound, has been on shakier ground recently, with greater sensitivity to inflation that has remained persistently above the Fed’s target, the primary contributor to an environment of higher interest rates. A reacceleration in prices could come at a fragile time for the economy and have a greater negative impact.
Our analysis of retail sales data would suggest that as much as 70% of all retail sales could be “discretionary” in nature, or perhaps more vulnerable to fluctuations in business cycles. While all categories eventually contracted during the GFC, discretionary categories saw sales pullback faster, falling 10% in the first 12 months while non-discretionary sales remained relatively steady. Furthermore, historical leasing data shows that direct-to-consumer businesses, including general retail, wholesalers, and e-commerce occupiers, collectively account for approximately 60% of all industrial leasing activity. With that in mind, plus the retail sales analysis above, we could assume that about 40% of new leasing activity (or 70% discretionary share of the direct-to-consumer leasing) could be impacted if discretionary spending were to slow.
While we have not seen a deterioration of business sentiment across our deep pool of current and prospective tenants nationally, many real-time discussions reflect planning around what they expect to be a short to medium-term disruption. As one recent example, an Asia-exposed-business is pulling forward inventory and a space expansion requirement it had planned for next year given their long-term business prospects and important U.S. customer base. Other occupiers are examining their port strategies to potentially add redundancy if bottlenecks arise from sudden trade shifts. Lower container shipping costs could also help offset rising tariff costs. The cost to ship a container from Shanghai to Los Angeles fell 23% year-over-over according to the latest data (April) from Drewry.
Demand Uncertainty Likely to Slow New Leasing: As of now, the most notable impact has been an increase in uncertainty, which we believe could slow leasing decisions in the coming quarters. However, typical leading demand indicators, such as port volumes, have continued expanding. We could see a surge in warehouse utilization in the short term (this started as early as 4Q24) as occupiers try to minimize supply chain disruptions and increase inventories given the perceived
risk of higher costs for imports in the future. Similar to other recent disruptions (like the first Trump administration tariffs, and recent port labor strikes), firms are pushing to stockpile inventories. Considering that businesses typically carry 2-3 months of inventory, and assuming that they are able to stock an additional 25% (consistent with the recent rise in TEU volume), businesses could have about 3-4 months of inventory buffer. If higher tariffs persist beyond that time frame, we could see an acceleration in the giveback of space, especially for less capitalized and more directly exposed tenants such as Asian third-party logistics (3PL).
Supply May Stay Lower for Longer: Supply has been trending down dramatically as new starts have fallen more than 60% from recent highs. Policy changes affecting construction input prices and immigration (labor availability) could very well keep starts lower for longer. Industrial’s construction process is less dependent on lumber, which recently saw threats of tariffs, but is more exposed to steel because of rebar, structure and framework, and other operational needs like storage racking. On average, steel can make up about 10-20% of industrial construction costs. However, a 25% tariff on steel should not have a 1 to 1 impact on costs because what the U.S. imports is normally just the raw material. Therefore, the tariff is typically applied to a fraction of the final cost to developers. A possible risk, however, is that a reduction in foreign supply could raise domestic prices. Labor makes up 40 to 60% of construction costs, which could represent a greater risk and have a larger impact, under current immigration policies. Tighter labor and modestly higher input costs along with more subdued occupier demand could result in even further downward pressure on new starts. This could help balance a
potential demand shortfall.
Rent Growth Rebound Likely Pushed Back to 2026: U.S. Industrial rent growth has been undergoing a rebalancing from an extended period of record growth. Our previous 2024 baseline outlook expected the rebalance to continue in 2025 with rent growth gaining pace and averaging 3% for the year, given the continued drop in new speculative development and the positive prospects for net absorption, including continued e-commerce growth and an uptick in manufacturing space demand. 2025 U.S. rent growth is still expected to be positive but could fall about 100 bps below previous expectations to levels near its LTA of 2% before gradually improving in 2026. Location and quality, however, will matter. Expectations are brighter for well located, high quality, Class A product given recent flight to quality trends. Our analysis of historical rent data shows that Class A product generally carries a 100 to 150 bps growth premium compared to overall market average rent. A prolonged trade war, nonetheless, could delay spending decisions and the longer it lasts the more it could delay our expected rebound in demand and rent growth, other things being equal.
FIGURE 4: U.S. INDUSTRIAL FORECAST
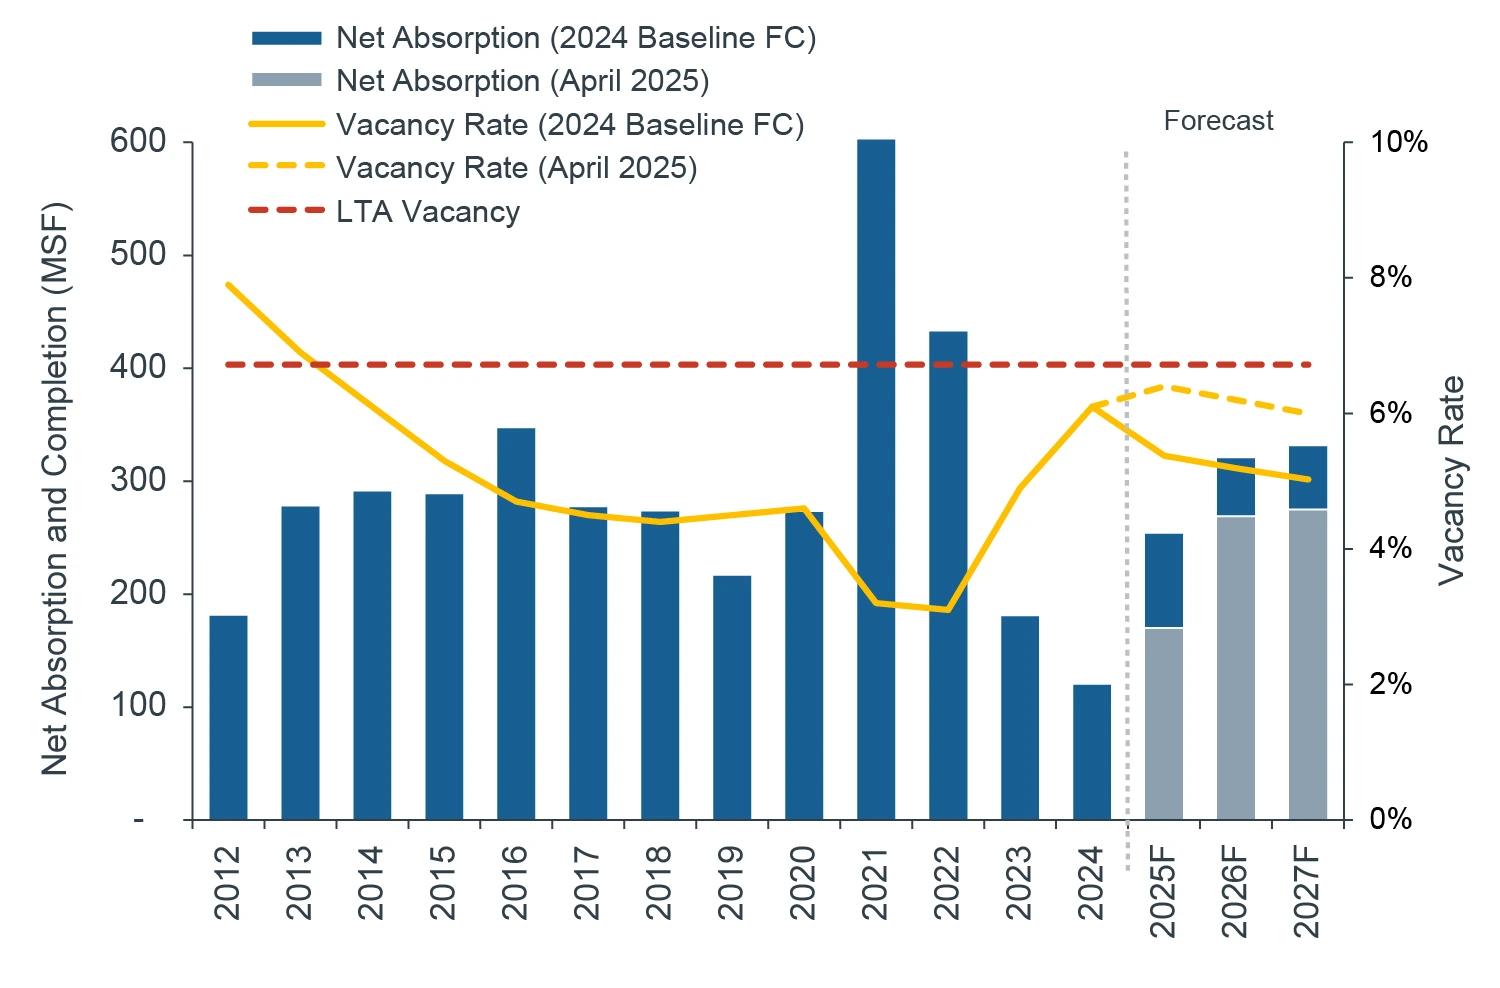
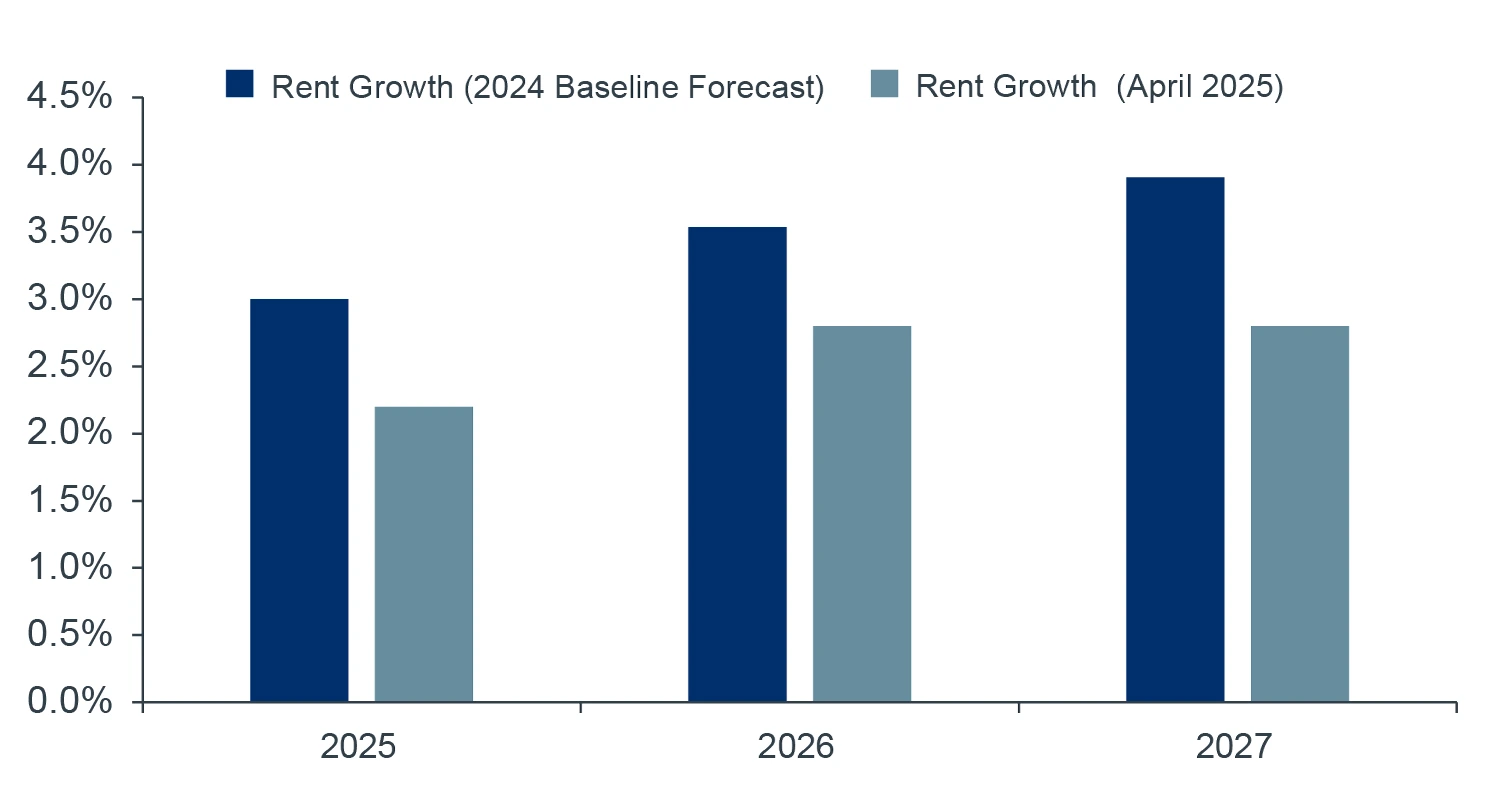
Source: Clarion Partners Global Research, CBRE-EA, Moody’s Analytics, April 2025.
- STRUCTURAL IMPACTS
Logistics Services Consumption Driven by E-commerce
Clarion’s analysis of leasing data shows that the secular growth of e-commerce has been a driving force for industrial and logistics demand since the global financial crisis. Consumer expectations for greater product variety, faster delivery speed, and convenience continue driving the need for better located, modern industrial real estate. Changes to trade policies are, we believe, unlikely to materially alter the long-term trend of e-commerce which has grown to exceed $1.1 trillion in annual sales and makes up nearly a quarter of core retail activity despite normalizing patterns after COVID-19. E-commerce sales are expected to grow at 5-10% annually post pandemic, continuing to gain market share from brick & mortar stores, potentially reaching 35% in the next decade see (Figure 5). While that alone should generate market opportunities given that e-commerce requires an estimated three times more space than traditional retail, market participants are constantly innovating and modernizing supply chains that allow for even greater product variety and faster delivery to more consumers, all while minimizing shipping costs. Logistics is at the center of that given transportation’s outsized share of logistics costs. Furthermore, while inbound facilities for imports play a necessary and key role in today’s supply chain, most of the leasing activity recently has been from domestic, demographic-driven distribution. As of April 2025, an estimated 286 million sq. ft. of new space could be needed over the next 5 years for e-commerce expansion alone.
Additionally, the impressive rise of online Asian marketplaces like Shein and Temu, along with the recent end to the De Minimis Exemption, could generate additional logistics demand in the future as those businesses are unlikely to abandon their now multi-billion-dollar businesses that largely service the U.S. consumer.
FIGURE 5: SHARE OF E-COMMERCE AS % OF CORE RETAIL SALES & SALES LEVELS
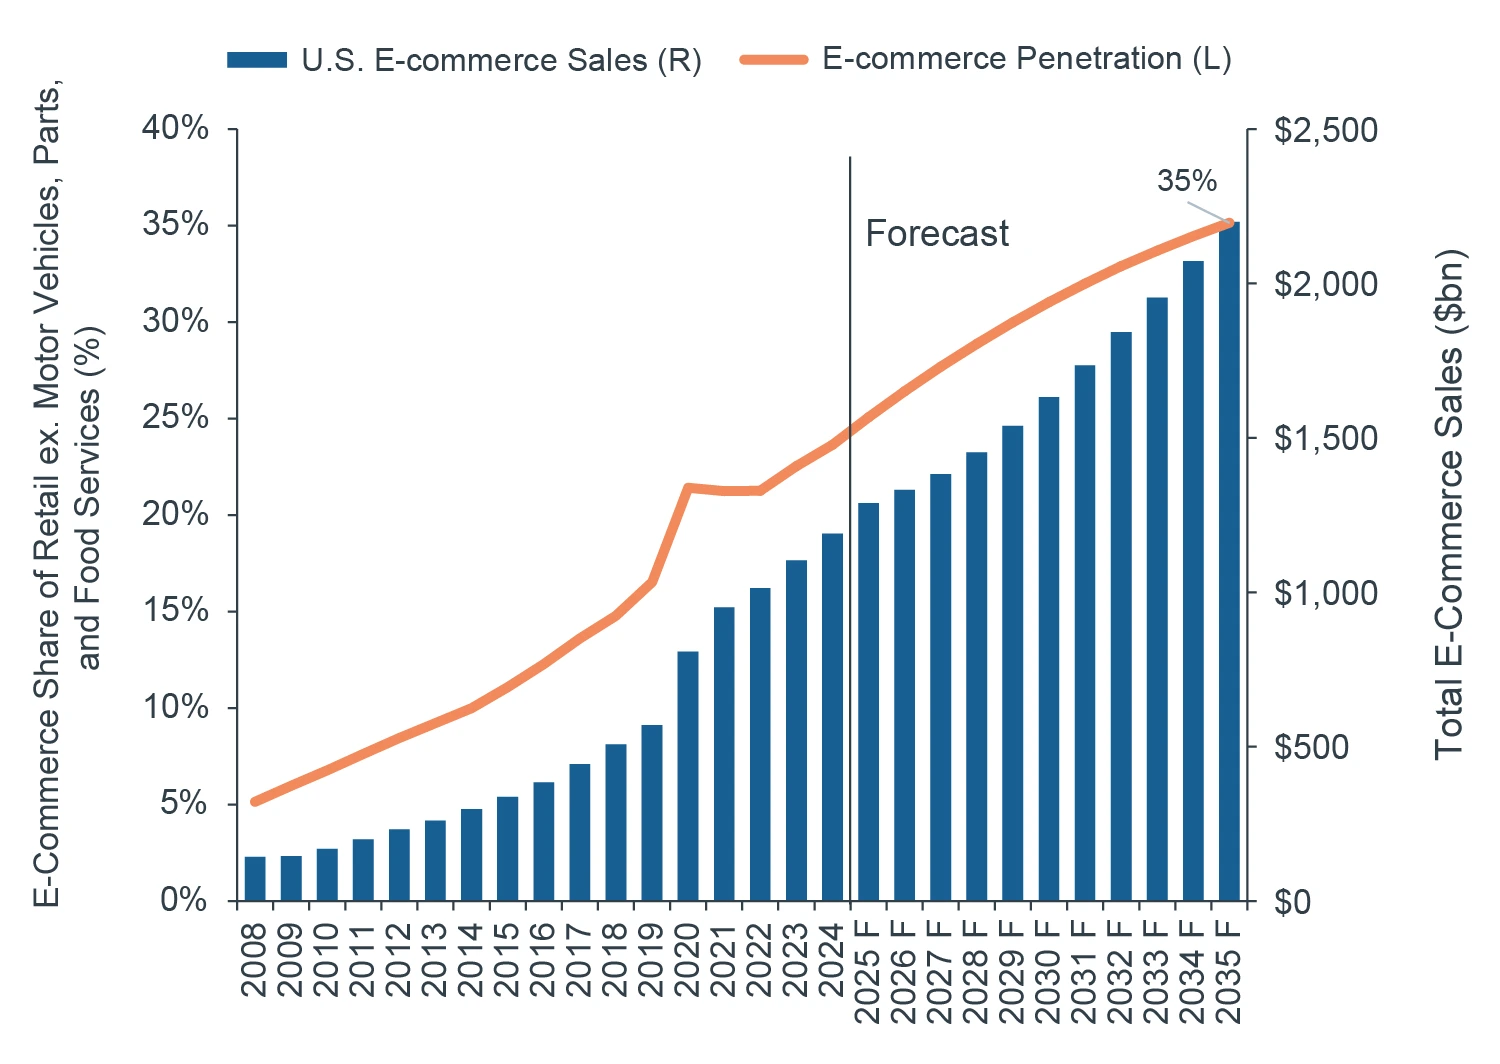
Source: Clarion Partners Global Research, CBRE-EA, Moody’s Analytics, April 2025.
INCREASING OBSOLESCENCE COMBINED WITH CHANGING LOGISTICS REQUIREMENTS ARE PUSHING TENANTS INTO MODERN SPACE
The shipping and distribution business has historically been both competitive and low margin. Clarion believes today’s logistics users are generally hyper-focused on throughput and efficiency, which typically means reducing the number of touchpoints and eliminating friction in the distribution and fulfillment process. Warehouse users demand well-located sites and prefer modern facilities to maximize efficiency. However, finding this space has become increasingly difficult.
The average U.S. warehouse is nearing 40 years old and can exceed 50 years in key gateway and infill submarkets, closing in on the typical warehouse lifespan of about 50 years. Over the next five years alone, approximately 8% of existing warehouse stock will reach or surpass this 50-year obsolescence threshold. Assuming half of such warehouse stock (4%) is truly obsolete implies that 0.8% of today’s stock per year requires replacement, equivalent to approximately 630 million sq.ft. over the next 5 years.
HIGH-VALUE-ADD MANUFACTURING CONTINUES TO MAKE GAINS IN THE U.S.
U.S. domestic manufacturing is likely to see growth and investment, perhaps considerable, through policies and subsidies, but also as firms attempt to establish a positive relationship with the current administration. This would likely be focused on high value-add, strategic, industries such as semiconductors, electric vehicles, and other high-tech industries. Through the end of 2024, the Biden administration had announced over $1 trillion in manufacturing projects across the U.S., with reports of an additional $7 trillion in announced investments under President Trump. While the likelihood of all those projects progressing remains unclear, adding this level of capacity to U.S. manufacturing would also require staffing and a significant investment into automation infrastructure and equipment, all of which would also require a substantial amount of time. We are tracking over 70 million sq. ft. of active manufacturing and R&D projects under construction. These projects will have a positive impact on industrial and logistics markets and their regional economies as they generate demand from suppliers and distributors (3-5x multiplier depending on the industry), as they remove land from the market that could have otherwise been speculative warehouse development, and through the creation of high paying jobs, which should lift consumption.
OPPORTUNITY COST & SUPPLY CHAIN DIVERSIFICATION AND "FRIENDSHORING"
The additional cost from tariffs will add pressure to all participants in a supply chain. While the ability to pass on the one-time price increase will depend on the price elasticity of the good, the available substitutes, and the overall health of the economy, firms may seek relief in a variety of ways, including diversifying their product sourcing. According to the latest CFO Survey from the Richmond Fed, over 30% of firms now rank trade and tariff policies as their most pressing business concern, which is more than triple the share from the previous quarter. Within manufacturing, more than half are planning to diversify their supply chains. Firms will need to weigh not only costs, but also time to market and the inherent supply chain risk that diversification could carry. Figure 6 below illustrates the alternative countries that firms are likely considering, including the impact to cost from current tariffs. While not free of social and political risk, Mexico could remain most attractive from a cost and time-to-market perspective. Southeast Asia, South America, and India offer compelling cost alternatives but with longer times to reach the U.S. market.
FIGURE 6: MANUFACTURING & SOURCING FACTORS
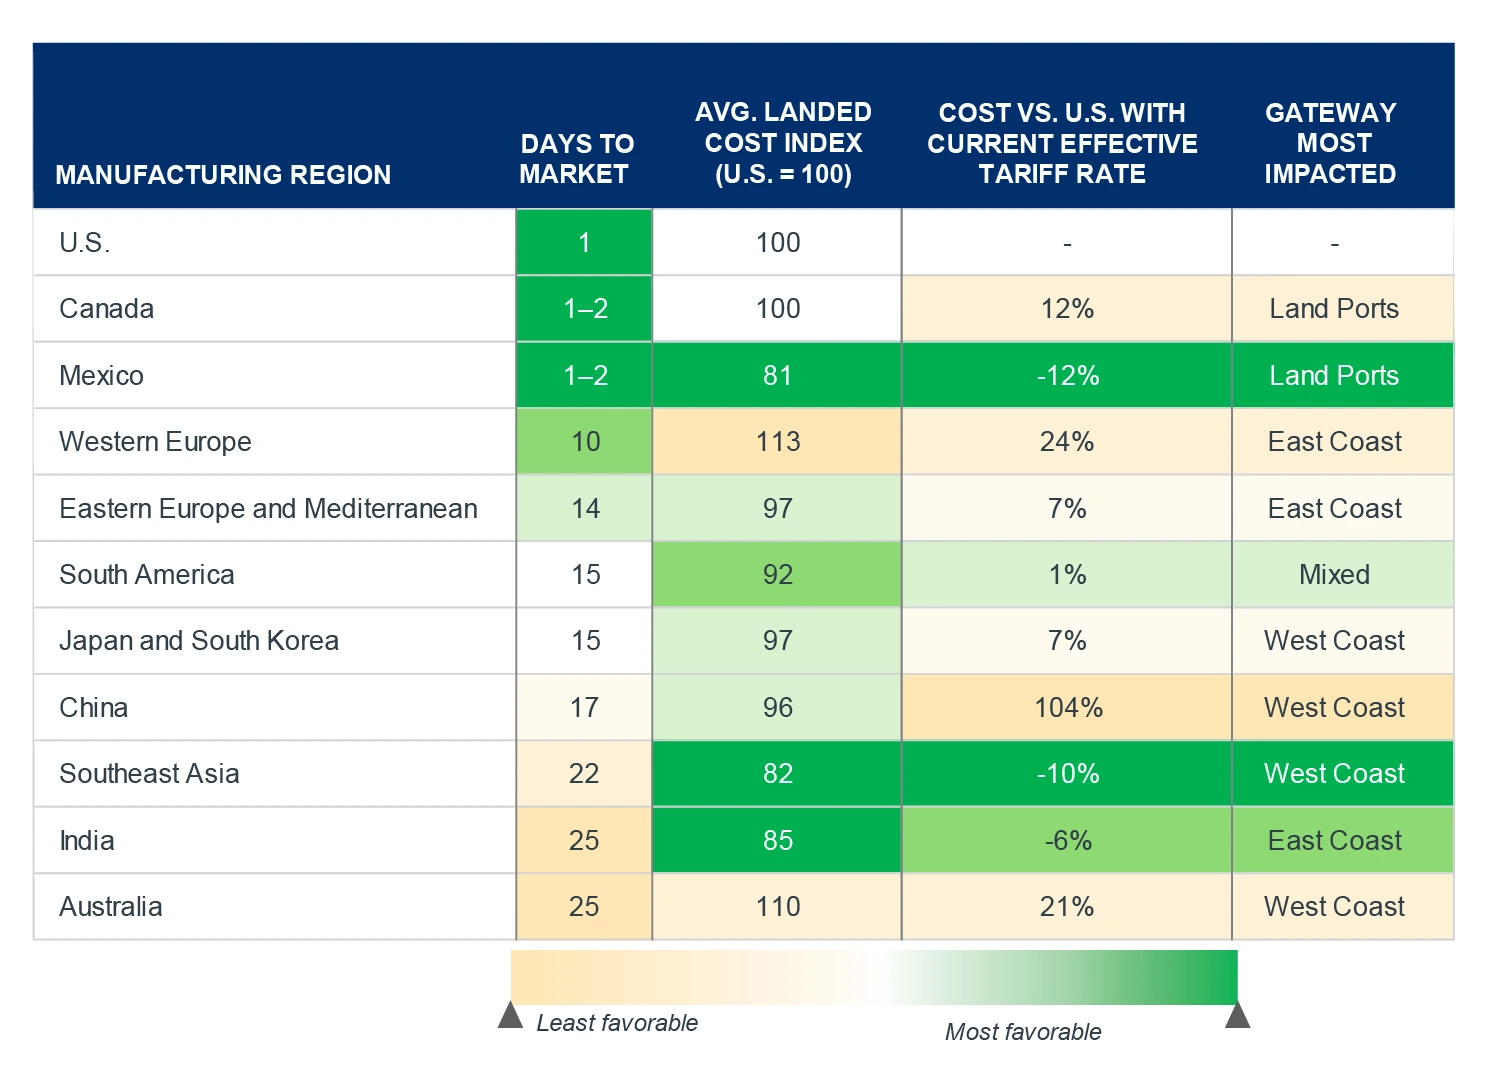
Source: Boston Consulting Group, Clarion Partners Global Research, Wells Fargo Economics, individual port authorities, April 2025.
Based on this information, we can assume that Mexico, Southeast Asia, India, and South America could remain viable alternative options as the risks rise for China and its $400 billion of annual exports to the U.S. This is likely to continue the trend observed over the last eight years, with fewer goods coming from China. We estimate that China imports will continue decreasing at an average annual rate of 5% to 10%, or 20-40% over the next five years. This would decrease China imports to levels not seen since before it joined the WTO in 2000, effectively erasing more than two decades of growth after adjusting for inflation.
Making the same continuous growth assumption, however, for East and Southeast Asia (ex. China), 5 to 10% growth annually and 30 to 60% growth over five years could offset the drop-off from China. After all, the region’s import dollar volume surpassed China’s in 2022. Mexico would also be poised to see volumes grow more than 20 to 40% over five years, keeping it at the top position by individual country and likely benefitting certain U.S. markets (Figure 7) per our analysis of GPS logistics transportation data.
FIGURE 7: U.S. - MEXICO TRADE FLOW ANALYSIS
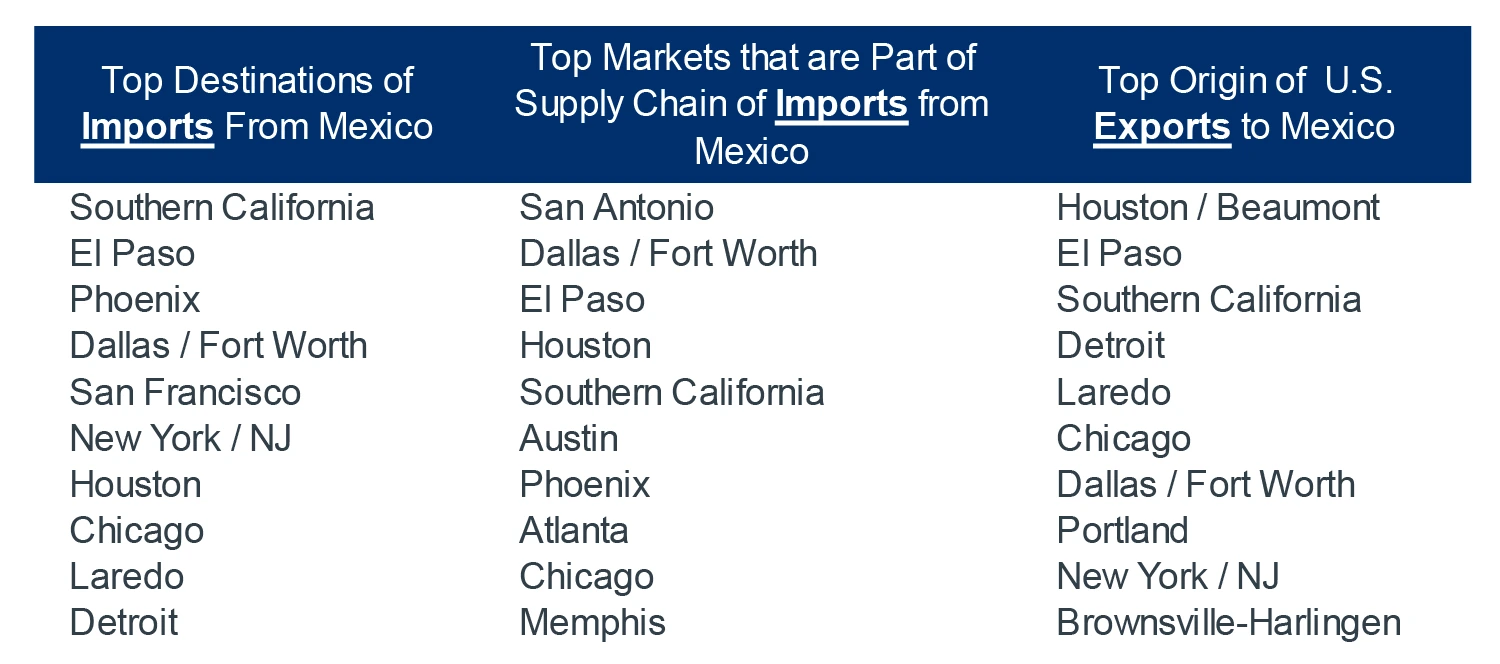
Source: Clarion Partners Global Research, U.S. Department of Transportation, International Trade Administration, Advan, Q3 2024. Southern California includes Los Angeles, Riverside, San Diego, and Orange County. First column is based on imports through Otay Mesa, El Paso, and Laredo.
MARKET IMPACTS
Southern California. The shift in trade patterns has also stirred discussions about industrial demand, market selection, and the long-term viability of existing gateways. It remains our view that while a decoupling or material reduction in trade with China could negatively impact near-term demand in markets like Southern California, the sharp rise observed in trade with East and Southeast Asia (ex. China) would soften the shortfall and preserve occupancy in gateway markets. This is also part of the explanation why, despite the sharp drop in imports from China, incoming TEU volumes at the ports of LA/LB have increased 20% since 2017 and its occupied industrial stock has increased 11% over the same period. Supply chain diversification has boosted volumes at nearly every U.S. port.
FIGURE 8: IMPORT TEU VOLUME AT MAJOR U.S. PORTS
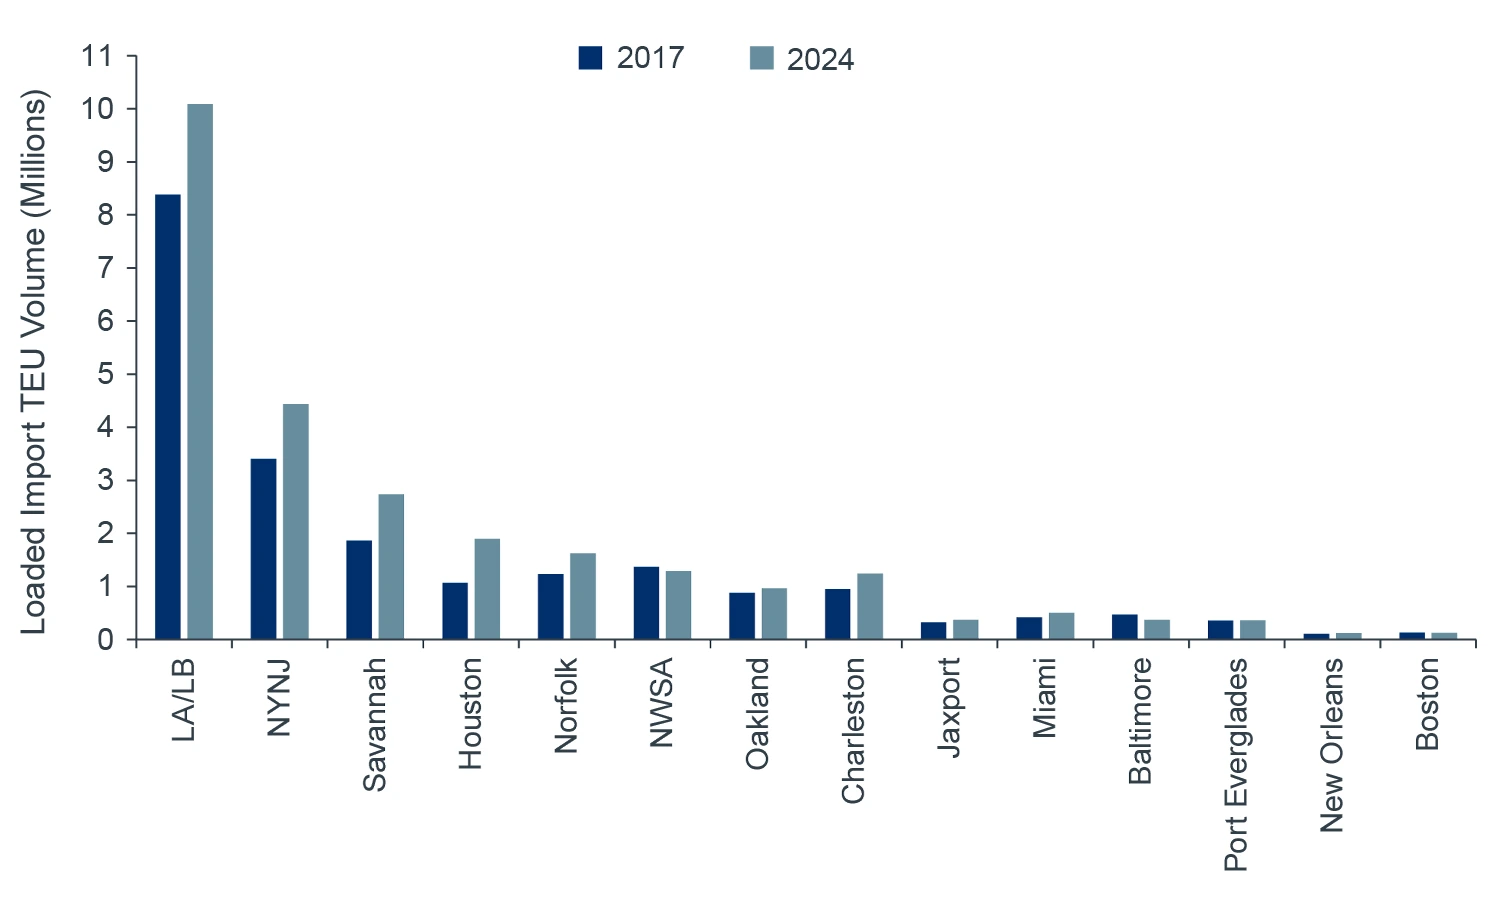
Source: Pacific Merchant Shipping Association, Individual Ports, Clarion Partners Global Research, Q1 2025.
As mentioned above, the industrial and logistics sector services consumption through a variety of property types and uses at every stage of the supply chain. This is no different for Southern California (which boasts a population over 21 million) that has been very adaptive to e-commerce consumption. The 7.1 million households in the greater Los Angeles area have a purchasing power (aggregate income) that exceeds $700 billion annually. In addition, SoCal has growing supply constraints due to local regulations, an unparalleled industrial labor base, and extensive industrial and logistics infrastructure which makes it a natural destination for the inbound flow of goods, including those moving north from Mexico.
U.S. Border Markets. Mexico’s growth has sparked investor appeal for markets like El Paso, Texas, which has seen notable growth recently. Our analysis shows that these border markets have been long underserved from a modern logistics supply (including large distribution facilities) since before the GFC and saw new supply pick up pace just recently. There could be an opportunity to capitalize on this supply shortage and the growing prospects of goods flowing to and from Mexico. Despite increased attention to these rapidly growing but still relatively small border markets, our analysis of GPS logistics transportation data suggests that incoming goods from Mexico largely flow through established markets, such as Dallas-Fort Worth and Houston, but also less obvious markets like Phoenix, Southern California, and several U.S. Southeast and Midwest markets, given their logistics infrastructure and demographic reach. Similar markets are also top origins of exports to Mexico, often for intermediary goods that are part of a greater bilateral value-add manufacturing supply chain. We believe investment in these more established markets also provides exposure to growing Mexico manufacturing.
CONCLUSION
There is a high likelihood that the tariffs in place today will look quite different a few months from now, but for now, the recent surge in tariffs increases the risk of a downside scenario across the broader U.S. economy. While the days of broad free flowing trade are possibly threatened for now, there remains a very compelling business case for the continued diversification of supply chains both globally and domestically depending on costs, supply chain risk, and the specific industry. Some countries may see their exports to the U.S. fall, but others will likely soften the impact and possibly generate growth opportunities, such as with the sharp rise of East and Southeast Asia which has benefitted Southern California. Tariffs will likely cause short-term challenges, but the impact should be mostly cyclical.
As tariffs introduce new challenges to industrial and logistics real estate, investors must steer their strategies through the uncertainty. The long-term drivers that have shaped the U.S. industrial market over the past 15+ years, leading to outperformance compared to other major property types, remain largely in place and durable today. Clarion believes that these structural dynamics should continue to drive growth within the industry and past cyclical uncertainty. Rather than react to what could well be short-term volatility, we are focused on taking an informed longer-term approach to investing in the sector. This includes developing and implementing a consistent strategy around market and asset selection, driven by the combination of diverse demand drivers, a strong transportation infrastructure to facilitate efficient movement of goods, and the ability to serve a regional market. Asset selection should favor modern buildings that can adapt to occupier needs, whether acquired or developed, which has proven beneficial for occupancy gains and rent growth outperformance over a longer-term horizon.